
Need segment-level traffic data?
Identify traffic patterns street by street and analyze the exact corridors that matter to your project.
Traffic | vehicles per day1,956 |
|---|---|
Trucks | 30.1% |
Average travel time | 32.9 min |
Congestion ratio | 6.3% |
Drivers’ average age | 56.7 yrs |
Drivers’ average income | $75,635 |
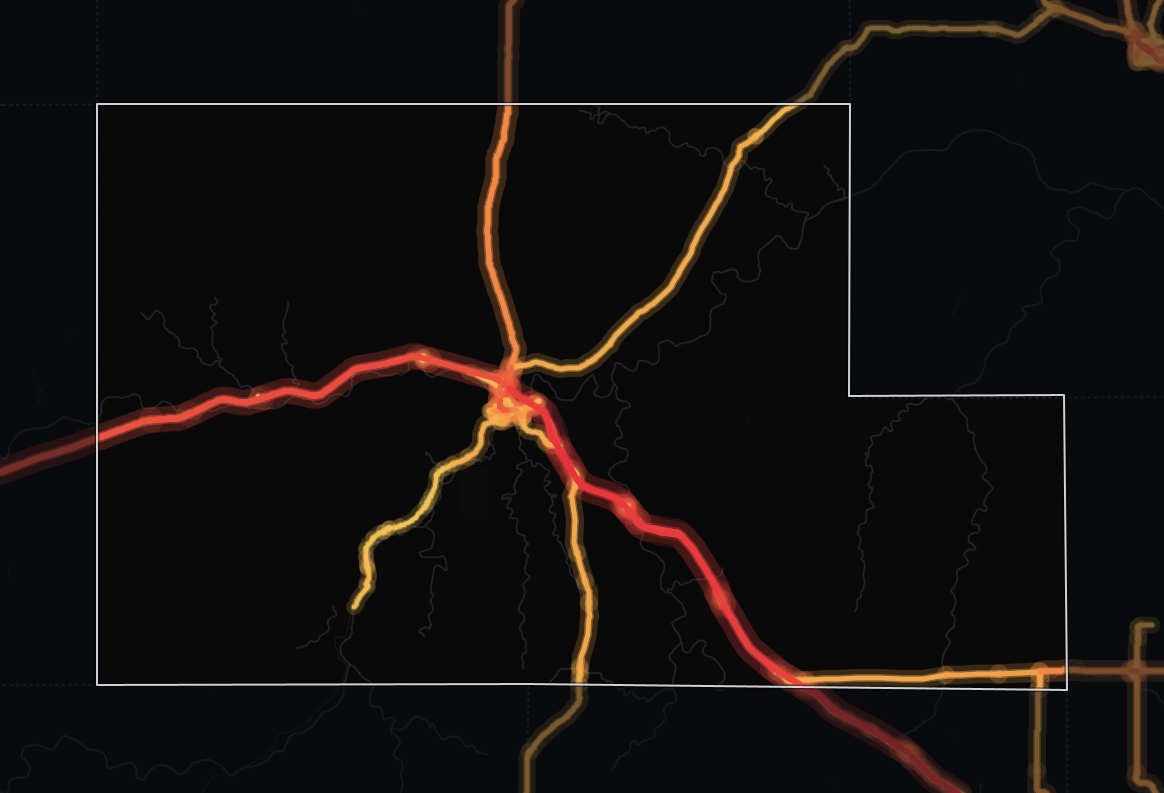
The average monitored road in Kimble County, Texas carries 1,956 vehicles per day. Across its 262 miles of monitored roads, that adds up to 734,695 vehicle-miles traveled per day (≈268 million per year). About 1 in 3 vehicles is a truck, well above the 9.8% across Texas - a freight-heavy mix.
Kimble sees 72% lower average daily traffic volume than the state average (1,956 vehicles per day against 6,895), suggesting less demand on each road - quiet roads that suit freight movement more than drive-by retail. Across the whole network, that travel is less than 0.1% of Texas's statewide total. By volume, Kimble's 1,956 vehicles per day trails 75% of counties in Texas.
Journey times here (32.9 minutes on average) closely track the state level. Its average travel time of 32.9 minutes is shorter than 68% of counties in Texas.
At 61% lower than the state level, the 6.3% congestion ratio signals smoother traffic flow - delays are rare enough to plan travel times almost to the minute.
| Traffic | vehicles per day5,316 |
|---|---|
| Trucks | 32.6% |
| Average travel time | 52.5 min |
| Congestion ratio | 11.4% |
| Drivers’ average age | 56.8 yrs |
| Drivers’ average income | $77,167 |
The vast majority of driving in Kimble County, Texas happens on highways: 89% of all vehicle-miles. The average highway carries 5,316 vehicles per day, 500% more than the average non-highway road in the same area, which carries 885 vehicles per day.
With 46% of the road miles (120 miles in 304 segments), highways punch above their length, carrying 653,971 vehicle-miles traveled per day (≈239 million per year).
55% of counties in Texas move less traffic on their highways.
At 32.6%, highway truck share is 137% higher than the state average. That marks Kimble as a major freight corridor, where highway access is what logistics operators compete on.
By truck concentration, highways here outrank 94% of counties in Texas. 63% of counties in Texas see fewer highway trucks per day than Kimble's roughly 1,731.
| Traffic | vehicles per day885 |
|---|---|
| Trucks | 9.9% |
| Average travel time | 26.6 min |
| Congestion ratio | 4.7% |
| Drivers’ average age | 56.0 yrs |
| Drivers’ average income | $74,006 |
Local roads carry only a small share of the traffic in Kimble County, Texas, 11% of all vehicle-miles. The average non-highway road carries 885 vehicles per day.
Local roads make up 54% of the monitored road miles (142 miles in 954 segments) but carry less than their share of travel: 80,724 vehicle-miles traveled per day (≈29.5 million per year). About 1 in 10 vehicles on non-highway roads is a truck (9.9%).
Non-highway roads carry a truck concentration that's 70% lower than the highway network.
The non-highway congestion ratio of 4.7% is 71% lower than the state level, suggesting more efficient local mobility than the state average.
Trip origins here have higher average income than 70% of counties in Texas. 98% of counties in Texas have a younger driver population than Kimble.


Mobile device location data (anonymized and aggregated)
Road sensor networks and traffic counters
Historical traffic pattern databases

Identify traffic patterns street by street and analyze the exact corridors that matter to your project.



