 Find my place


The average time of vehicle travel for all vehicles traveling over the county road network.
The rate at which the actual travel time exceeds free-flow travel time.
Average age of drivers in vehicles traveling over the county road network.
Average income of drivers in vehicles traveling over the county road network.
The mean length of a trip taken by drivers over the county road network.

The average time of vehicle travel for all vehicles traveling over the county highway network.
The rate at which the actual travel time exceeds free-flow travel time.
Average age of drivers in vehicles traveling over the county highway network.
Average income of drivers in vehicles traveling over the county highway network.
The mean length of a trip taken by drivers over the county road network.

The average time of vehicle travel for all vehicles traveling over the county non-highway roads.
The rate at which the actual travel time exceeds free-flow travel time.
Average age of drivers in vehicles traveling over the county non-highway roads.
Average income of drivers in vehicles traveling over the county non-highway roads.
The mean length of a trip taken by drivers over the county non-highway roads.
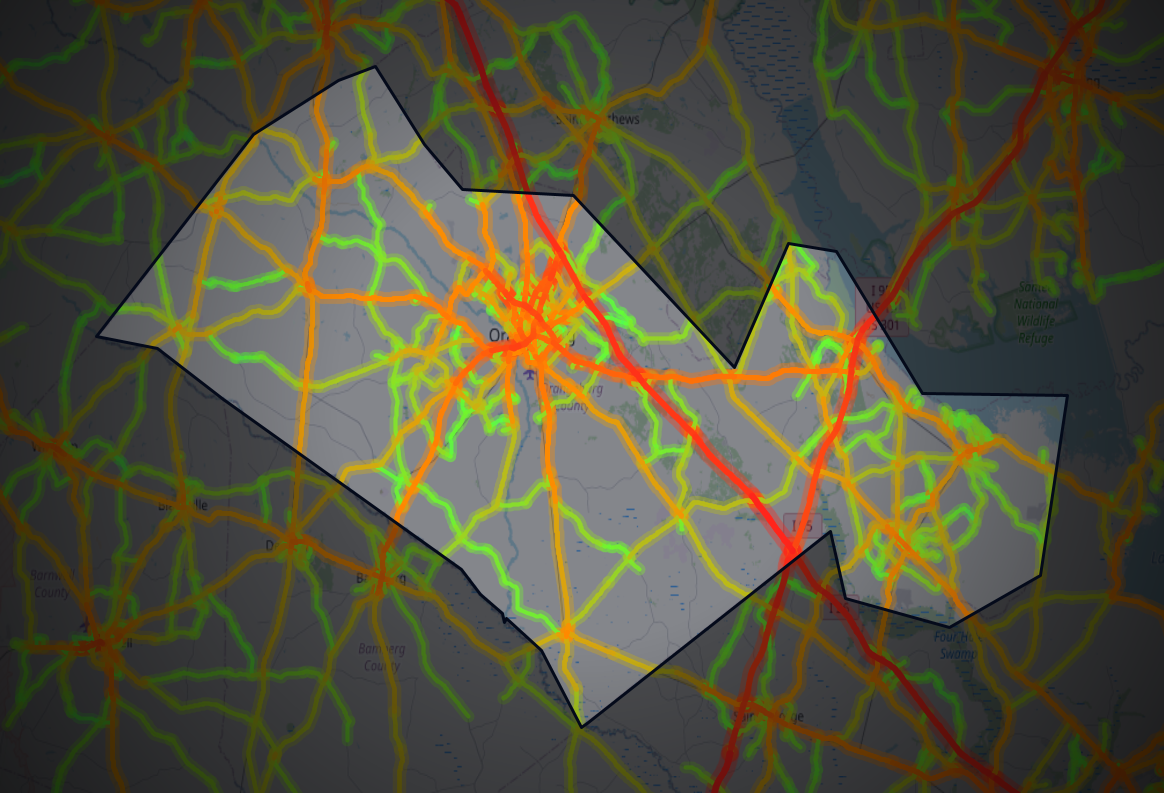
Identify traffic patterns street by street and analyze the exact corridors that matter to your project.