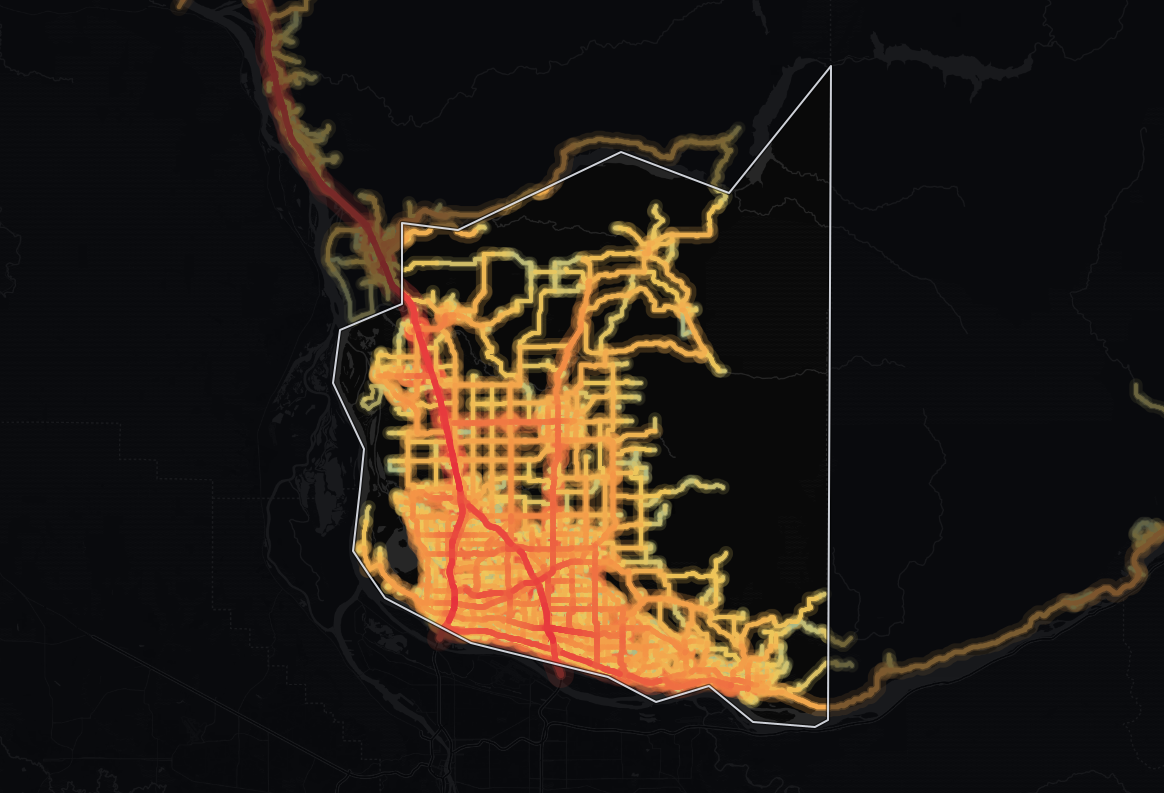
This page delivers traffic analytics for Clark County, Washington. Our metrics are calculated with multi-sourced, cross-verified data from real-world mobile and sensor networks, and averaged for Clark County, Washington among 1,043 road miles divided in 34,663 segments. Our metrics go beyond simple volume counts to provide actionable insights on traffic intensity, congestion, commercial vehicle flow, and network performance with highest possible granularity (average segment length is 159 ft). Whether you are evaluating a new retail location, planning logistics routes, or assessing infrastructure needs, this data helps you move from assumptions to certainty.
Data sourced from TrafficZoom's proprietary analytics platform.
The average number of vehicles that travel each day over any road in the road network.
6,209
Trucks
Trucks
The percentage of the total traffic volume composed of heavy vehicles.
5.7%
Average travel time
Average travel time
The average time of travel averaged among all vehicles traveling on the road network.
29.8 min
Congestion ratio
Congestion ratio
The rate at which the actual travel time exceeds free-flow travel time, averaged among all roads in the network.
20.3%
Drivers’ average age
Average age of residents in the geographic areas where the vehicle trips originated.
45.0 yrs
Drivers’ average income
Average income of residents in the geographic areas where the vehicle trips originated.
$100,664
Our data indicates an estimated average traffic volume of 6,209 vehicles per day in Clark County, Washington that results in 8,959,052 vehicle-miles traveled per day (≈3.3 billion per year). The traffic stream is comprised of an average of 1 truck for every 18 vehicles. Typical time spent behind the wheel per trip is 29.8 minutes, which already accounts for delays at signals, intersections, and congestion.
Analytical insight
When compared to the Washington state averages: At 6,209 vehicles per day, the average monitored road in Clark carries 15% less traffic than the state average of 7,322 vehicles per day - a critical factor for logistics and site planning. Network-wide, Clark accounts for about 5.8% of Washington's statewide total, at 8,959,052 vehicle-miles traveled per day (≈3.3 billion per year). Journey times run 10% lower than the state level, at 29.8 minutes on average. At 2% higher than the state level, the 20.3% congestion ratio signals more pronounced congestion - crucial for traffic control improvement and logistics planning. Clark carries more traffic than 82% of counties in Washington. 5% of counties in Washington have a shorter average travel time than Clark's 29.8 minutes.
Highway vs. Non-Highway Traffic Analysis
Highway Traffic
Traffic
Traffic
The average number of vehicles that travel each day over any road in the road network.
24,360
Trucks
Trucks
The percentage of the total traffic volume composed of heavy vehicles.
7.5%
Average travel time
Average travel time
The average time of travel averaged among all vehicles traveling on the road network.
32.4 min
Congestion ratio
Congestion ratio
The rate at which the actual travel time exceeds free-flow travel time, averaged among all roads in the network.
48.3%
Drivers’ average age
Average age of residents in the geographic areas where the vehicle trips originated.
45.4 yrs
Drivers’ average income
Average income of residents in the geographic areas where the vehicle trips originated.
$98,805
A significant volume of traffic in Clark County, Washington utilizes the highway network. The average highway carries 24,360 vehicles per day, 323% more than the average non-highway road in the same area, which carries 5,752 vehicles per day. That average covers 132 highway road miles divided in 850 segments (average segment length 821 ft), together carrying 4,113,051 vehicle-miles traveled per day (≈1.5 billion per year). No more than 4 other counties in Washington move more traffic on their highways. Trucks constitute 7.5% of highway traffic.
Analytical insight
The concentration of trucks on highways (7.5%) is 21% lower than the state average for similar road classifications. This indicates Clark serves as a primarily local traffic hub. For logistics operators, this validates the importance of local access. By truck concentration, highways here outrank 19% of counties in Washington. 81% of counties in Washington see fewer highway trucks per day than Clark's roughly 1,820.
Non-highway traffic
Traffic
Traffic
The average number of vehicles that travel each day over any road in the road network.
5,752
Trucks
Trucks
The percentage of the total traffic volume composed of heavy vehicles.
4.1%
Average travel time
Average travel time
The average time of travel averaged among all vehicles traveling on the road network.
29.7 min
Congestion ratio
Congestion ratio
The rate at which the actual travel time exceeds free-flow travel time, averaged among all roads in the network.
19.6%
Drivers’ average age
Average age of residents in the geographic areas where the vehicle trips originated.
44.8 yrs
Drivers’ average income
Average income of residents in the geographic areas where the vehicle trips originated.
$102,060
The non-highway road network in Clark County, Washington supports a substantial volume of traffic. The average non-highway road carries 5,752 vehicles per day, 76% less than the average highway in the same area, which carries 24,360 vehicles per day. That average covers 910 non-highway road miles divided in 33,813 segments (average segment length 142 ft), together carrying 4,846,002 vehicle-miles traveled per day (≈1.8 billion per year). Trucks constitute 4.1% of non-highway traffic.
Analytical insight
Non-highway roads carry a truck concentration that's 45% lower than the highway network. Non-highway congestion here (19.6%) closely tracks the state average. Overall, average travel time here is longer than 5% of counties in Washington. Trip origins here have higher average income than 92% of counties in Washington. Clark's median driver age is higher than 32% of counties in Washington.
Time-of-Day & Seasonal Patterns
Peak Traffic Windows
Weekday peaks:
AM peak 8:00 AM–12:00 PM and PM peak 3:00 PM–8:00 PM, with volumes reaching approximately 83% higher than the daily average.
Weekend traffic:
Weekend volumes run about 12% below weekday levels.
Seasonal Fluctuation
Busy season:
June–August is the high season, with volumes +8% versus the annual average.
Lowest month:
February is the quietest month, with volumes -14% versus the annual average.
Analytical insight
In Clark County, Washington, the peak hour concentrates about 8% of the day's traffic, and seasonal swing is mild at +8% in high season.
Traffic Flow Profile Comparison
Metric
Clark
Washington
Average
Difference
Traffic
6,209
7,322
-15.2%
Truck % (Total Traffic)
5.7%
7.1%
-20.4%
Truck % (Highway)
7.5%
9.5%
-21.5%
Avg. Travel Time
29.8 min
33.2 min
-10.3%
Frequently Asked Questions
The average daily traffic volume is calculated at 6,209 vehicles per day, providing a baseline for daily operations and site assessment.
Clark's highway truck share of 7.5% is higher than 19% of counties in Washington.
The average travel time for drivers is 29.8 minutes, offering a standard metric for commute and delivery route planning.
Weekday peaks occur between 8:00 AM and 12:00 PM in the morning and between 3:00 PM and 8:00 PM in the evening - about 83% above the daily average.
Trucks account for approximately 5.7% of the total traffic mix across all road types, with a significantly higher concentration of 7.5% on highways.
Traffic volumes are typically 8% higher during June–August. Volumes drop to their lowest levels in February, averaging 5,366 vehicles per day - a 14% decrease from the annual average.
Drivers on Clark roads have a median age of 45 years, and the median household income of the neighborhoods trips originate from averages $100,664 - useful context for retail siting and customer profiling.
Approximately 8% of highway traffic and 1% of non-highway traffic consists of vehicles whose trip originates outside Clark County, Washington. This indicates that a portion of highway traffic is regional pass-through, while local roads are more representative of resident and commuter activity.
Data Sources & Methodology
The data presented on this page is derived from TrafficZoom's proprietary analytics platform, which aggregates and normalizes information from multiple sources, including:
Mobile device location data (anonymized and aggregated)