
Need segment-level traffic data?
Identify traffic patterns street by street and analyze the exact corridors that matter to your project.
Traffic | vehicles per day10,652 |
|---|---|
Trucks | 6.3% |
Average travel time | 34.4 min |
Congestion ratio | 28.1% |
Drivers’ average age | 47.4 yrs |
Drivers’ average income | $137,860 |
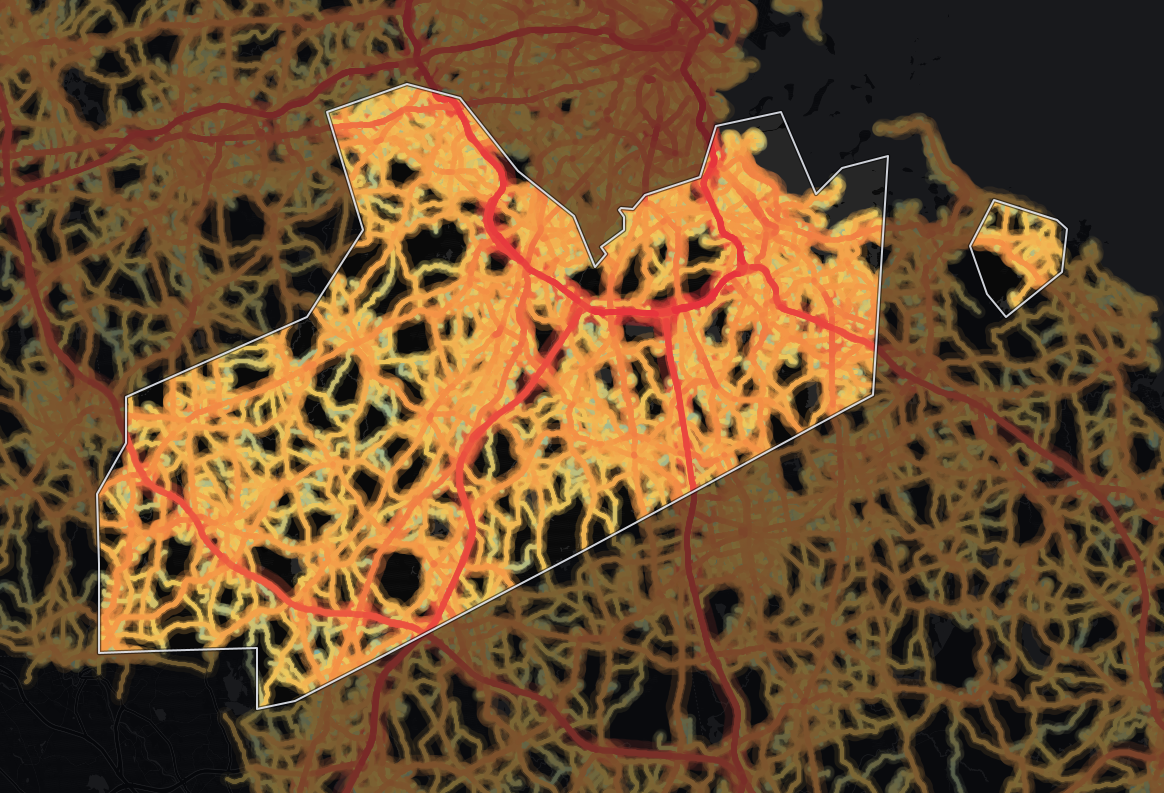
A typical monitored road in Norfolk County, Massachusetts sees 10,652 vehicles per day, while its 1,087 miles of monitored roads together handle 16,383,687 vehicle-miles traveled per day (≈6.0 billion per year). About 1 in 16 vehicles is a truck, in line with Massachusetts (6.9%).
Norfolk's average daily traffic volume is 30% higher than the state average - 10,652 vehicles per day against 8,166 - suggesting more traffic load per road - a busier backdrop for retail sites, at the cost of slower access. Network-wide, Norfolk accounts for about 12% of Massachusetts's statewide total of vehicle-miles. By volume, Norfolk's 10,652 vehicles per day outpaces 92% of counties in Massachusetts.
At 34.4 minutes, the average travel time matches the state level closely. 54% of counties in Massachusetts have a shorter average travel time than Norfolk's 34.4 minutes.
Congestion runs 17% higher than the state level, at a ratio of 28.1%, which means more pronounced congestion - relevant for traffic control and delivery planning.
| Traffic | vehicles per day37,818 |
|---|---|
| Trucks | 6.9% |
| Average travel time | 42.2 min |
| Congestion ratio | 59.1% |
| Drivers’ average age | 47.1 yrs |
| Drivers’ average income | $137,100 |
Highways carry about half of all travel in Norfolk County, Massachusetts, 52% of vehicle-miles. The average highway carries 37,818 vehicles per day, 283% more than the average non-highway road in the same area, which carries 9,885 vehicles per day.
That comes from just 16% of the monitored road miles: 172 miles in 1,150 segments, carrying 8,475,214 vehicle-miles traveled per day (≈3.1 billion per year).
That puts Norfolk among the top 3 counties in Massachusetts for highway travel volume.
The concentration of trucks on highways (6.9%) is 18% lower than the state average for similar road classifications. Trucks are a small share of a very large highway flow, so Norfolk still moves heavy freight volumes alongside its passenger traffic.
By truck concentration, highways here trail 82% of counties in Massachusetts. Norfolk also moves the highest raw count of highway trucks in Massachusetts, at roughly 3,409 per day.
| Traffic | vehicles per day9,885 |
|---|---|
| Trucks | 5.6% |
| Average travel time | 34.2 min |
| Congestion ratio | 27.2% |
| Drivers’ average age | 47.9 yrs |
| Drivers’ average income | $138,323 |
Local roads carry about half of all travel in Norfolk County, Massachusetts, 48% of vehicle-miles. On the average non-highway road, that comes to 9,885 vehicles per day.
Spread over 915 miles and 40,736 segments, 84% of the road network, local roads carry a lighter load per mile: 7,908,473 vehicle-miles traveled per day (≈2.9 billion per year). About 1 in 18 vehicles on non-highway roads is a truck (5.6%).
Compared to highways, non-highway routes see 20% fewer trucks by share.
At 18% higher than the state level, the non-highway congestion ratio of 27.2% signals more friction on local roads.
Trip origins here have higher average income than 92% of counties in Massachusetts. 62% of counties in Massachusetts have an older driver population than Norfolk.


Mobile device location data (anonymized and aggregated)
Road sensor networks and traffic counters
Historical traffic pattern databases

Identify traffic patterns street by street and analyze the exact corridors that matter to your project.



