
Need segment-level traffic data?
Identify traffic patterns street by street and analyze the exact corridors that matter to your project.
Traffic | vehicles per day3,126 |
|---|---|
Trucks | 10.8% |
Average travel time | 40.9 min |
Congestion ratio | 9.9% |
Drivers’ average age | 50.9 yrs |
Drivers’ average income | $60,916 |
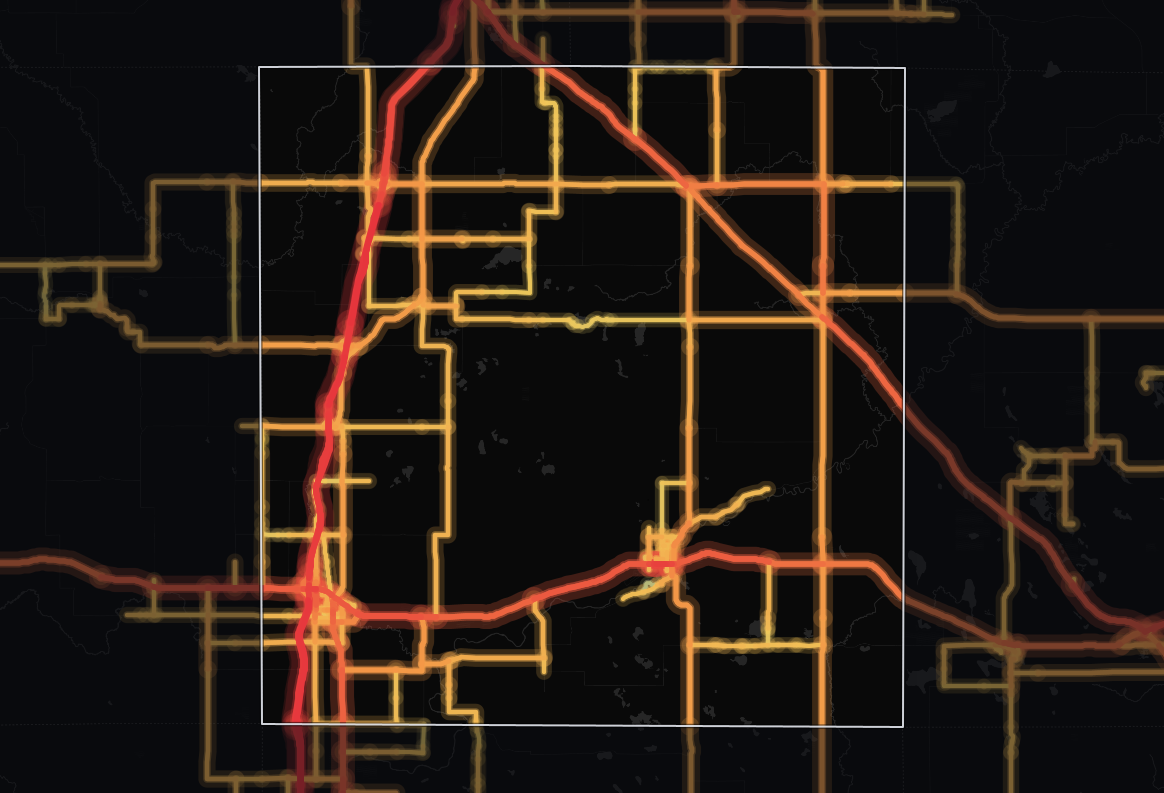
A typical monitored road in Osceola County, Michigan sees 3,126 vehicles per day, while its 278 miles of monitored roads together handle 952,765 vehicle-miles traveled per day (≈348 million per year). At 10.8%, the truck share runs above the 7.7% across Michigan: about 1 in 9 vehicles.
Osceola's average daily traffic volume is 59% lower than the state average - 3,126 vehicles per day against 7,697 - suggesting less traffic load per road - quiet roads that suit freight movement more than drive-by retail. In total volume terms, its road network carries about 0.4% of Michigan's statewide total of vehicle-miles. 71% of counties in Michigan see more traffic than Osceola's 3,126 vehicles per day.
The average trip takes 40.9 minutes, 22% higher than the state level. 98% of counties in Michigan have a shorter average travel time than Osceola's 40.9 minutes.
At 46% lower than the state level, the 9.9% congestion ratio signals smoother traffic flow - travel times are easy to plan around for scheduled deliveries.
| Traffic | vehicles per day6,430 |
|---|---|
| Trucks | 14.8% |
| Average travel time | 65.0 min |
| Congestion ratio | 15.9% |
| Drivers’ average age | 50.5 yrs |
| Drivers’ average income | $66,386 |
Travel in Osceola County, Michigan splits roughly evenly, with about half of it (50% of vehicle-miles) on highways. The average highway carries 6,430 vehicles per day, 146% more than the average non-highway road in the same area, which carries 2,612 vehicles per day.
Highways make up 25% of the monitored road miles (69 miles, 234 segments), so they carry more than their share: 477,980 vehicle-miles traveled per day (≈174 million per year).
Highway truck concentration here runs 24% higher than the state average, at 14.8%. Highways here lean toward freight, so highway access is a real asset for logistics operators.
Osceola's highway truck share (14.8%) is higher than 86% of counties in Michigan. 56% of counties in Michigan see fewer highway trucks per day than Osceola's roughly 952.
| Traffic | vehicles per day2,612 |
|---|---|
| Trucks | 6.9% |
| Average travel time | 37.1 min |
| Congestion ratio | 9.0% |
| Drivers’ average age | 51.3 yrs |
| Drivers’ average income | $58,418 |
Travel in Osceola County, Michigan splits roughly evenly, with about half of it (50% of vehicle-miles) on local roads. A typical local road sees 2,612 vehicles per day.
Spread over 210 miles and 1,506 segments, 75% of the road network, local roads carry a lighter load per mile: 474,784 vehicle-miles traveled per day (≈173 million per year). About 1 in 15 vehicles on non-highway roads is a truck (6.9%).
Compared to highways, non-highway routes see 54% fewer trucks by share.
At 51% lower than the state level, the non-highway congestion ratio of 9.0% signals easier movement on local roads.
Trip origins here have lower average income than 66% of counties in Michigan. The driver population here skews older than 51% of counties in Michigan.


Mobile device location data (anonymized and aggregated)
Road sensor networks and traffic counters
Historical traffic pattern databases

Identify traffic patterns street by street and analyze the exact corridors that matter to your project.



