
Need segment-level traffic data?
Identify traffic patterns street by street and analyze the exact corridors that matter to your project.
Traffic | vehicles per day5,461 |
|---|---|
Trucks | 7.7% |
Average travel time | 33.3 min |
Congestion ratio | 16.1% |
Drivers’ average age | 45.0 yrs |
Drivers’ average income | $92,606 |
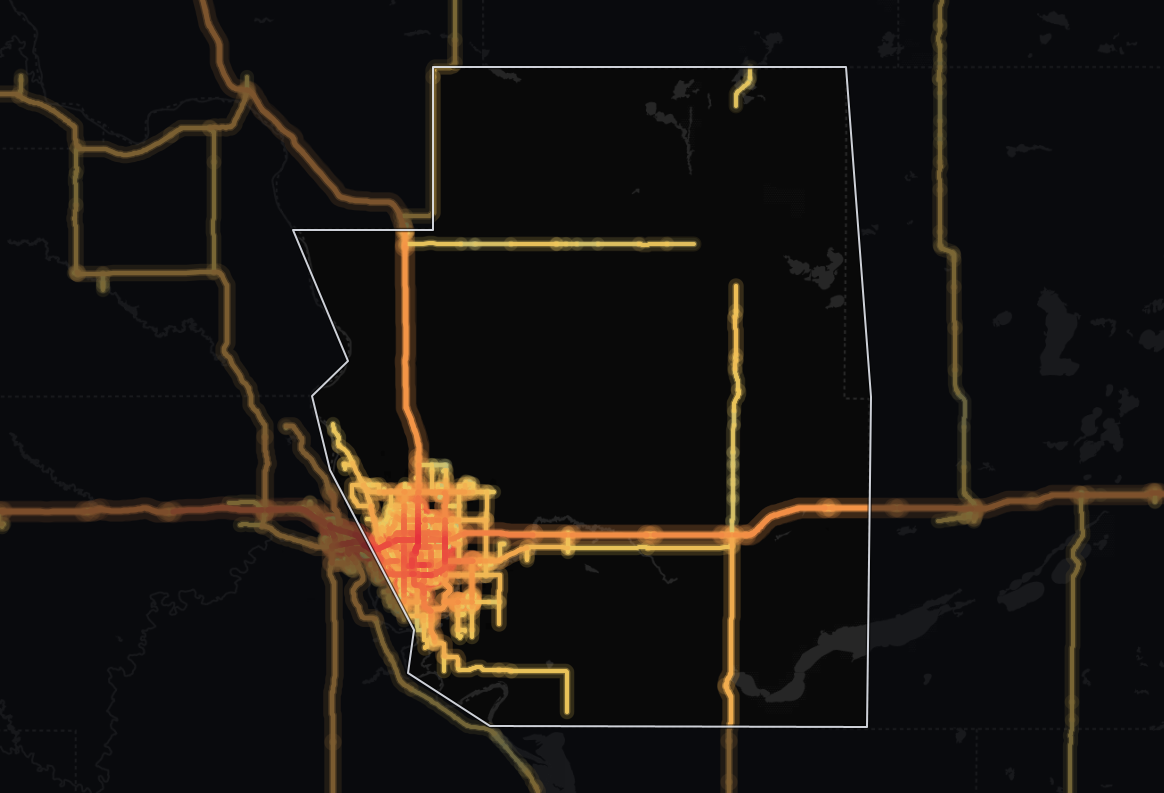
Our data shows 5,461 vehicles per day on the average road in Burleigh County, North Dakota, and 1,548,932 vehicle-miles traveled per day (≈565 million per year) across its 485 miles of monitored roads. Trucks are a smaller part of the mix than across North Dakota: 7.7% against 11.1%.
Burleigh's average daily traffic volume is 151% higher than the state average - 5,461 vehicles per day against 2,174 - suggesting more traffic load per road - prime passing trade for storefronts, with more competition for road space. Network-wide, Burleigh accounts for about 8.8% of North Dakota's statewide total of vehicle-miles. At 5,461 vehicles per day, Burleigh posts the highest average traffic volume in North Dakota.
Journey times run 10% lower than the state level, at 33.3 minutes on average. Its average travel time of 33.3 minutes is shorter than 81% of counties in North Dakota.
At 52% higher than the state level, the 16.1% congestion ratio signals more pronounced congestion - peak-hour routing and delivery windows need real slack here.
| Traffic | vehicles per day5,649 |
|---|---|
| Trucks | 12.5% |
| Average travel time | 33.1 min |
| Congestion ratio | 14.0% |
| Drivers’ average age | 45.8 yrs |
| Drivers’ average income | $93,723 |
A significant share of driving in Burleigh County, North Dakota, 38% of vehicle-miles, happens on highways. The average highway carries 5,649 vehicles per day, about the same as the average non-highway road in the same area (5,445 vehicles per day).
Their share of road miles is similar, 32% (155 miles in 398 segments), carrying 581,706 vehicle-miles traveled per day (≈212 million per year).
By highway travel volume, that ranks Burleigh in the top 5 counties in North Dakota.
At 12.5%, highway truck share is 14% lower than the state average. The highway traffic mix is typical for North Dakota: neither freight- nor commuter-dominated.
82% of counties in North Dakota see a higher highway truck share than Burleigh's 12.5%. Burleigh's highway truck count is higher than 82% of counties in North Dakota, at roughly 704 trucks per day.
| Traffic | vehicles per day5,445 |
|---|---|
| Trucks | 4.8% |
| Average travel time | 33.3 min |
| Congestion ratio | 16.2% |
| Drivers’ average age | 44.9 yrs |
| Drivers’ average income | $92,173 |
A little more than half of the driving in Burleigh County, North Dakota happens on local roads: 62% of all vehicle-miles. On the average non-highway road, that comes to 5,445 vehicles per day.
Their share of road miles is similar, 68% (330 miles in 4,670 segments), carrying 967,226 vehicle-miles traveled per day (≈353 million per year). About 1 in 21 vehicles on non-highway roads is a truck (4.8%).
Compared to highways, non-highway routes see 61% fewer trucks by share.
Non-highway congestion (16.2%) runs 50% higher than the state average, pointing to slower local traffic flow.
96% of counties in North Dakota see lower average driver income among trip origins than Burleigh. Burleigh's median driver age is lower than 71% of counties in North Dakota.


Mobile device location data (anonymized and aggregated)
Road sensor networks and traffic counters
Historical traffic pattern databases

Identify traffic patterns street by street and analyze the exact corridors that matter to your project.



