
Need segment-level traffic data?
Identify traffic patterns street by street and analyze the exact corridors that matter to your project.
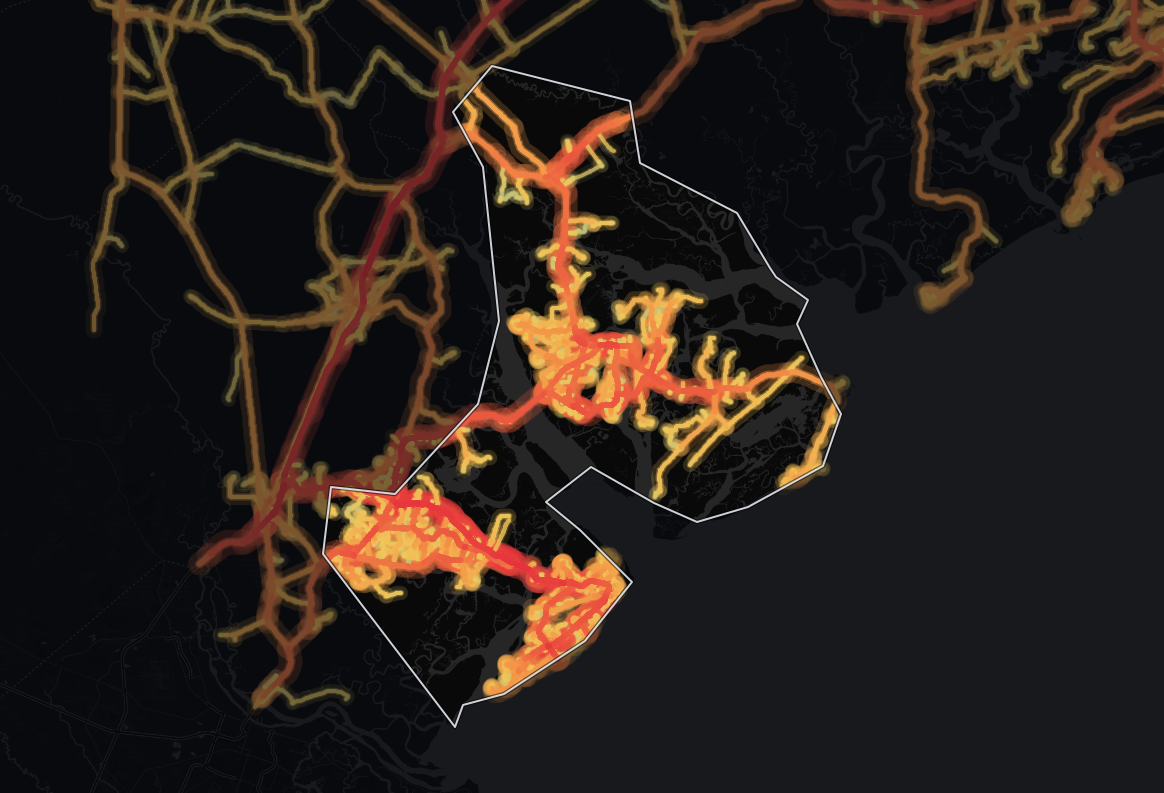
TrafficThe average number of vehicles that travel each day over any road in the road network. | vehicles per day12,398 |
|---|---|
TrucksThe percentage of the total traffic volume composed of heavy vehicles. | 5.3% |
Average travel timeThe average time of travel averaged among all vehicles traveling on the road network. | 28.7 min |
Congestion ratioThe rate at which the actual travel time exceeds free-flow travel time, averaged among all roads in the network. | 30.2% |
Drivers’ average ageAverage age of residents in the geographic areas where the vehicle trips originated. | 52.5 yrs |
Drivers’ average incomeAverage income of residents in the geographic areas where the vehicle trips originated. | $89,268 |
Our data shows 12,398 vehicles per day on the average road in Beaufort County, South Carolina, and 3,810,461 vehicle-miles traveled per day (≈1.4 billion per year) across its 316 miles of monitored roads. Traffic here is mostly passenger cars: only 5.3% trucks, against 9.5% across South Carolina.
Beaufort sees 76% higher average daily traffic volume than the state average (12,398 vehicles per day against 7,040), suggesting more demand on each road - prime passing trade for storefronts, with more competition for road space. In total volume terms, its road network carries about 2.6% of South Carolina's statewide total of vehicle-miles. Beaufort carries more traffic than 98% of counties in South Carolina.
At 28.7 minutes, the average travel time is 14% lower than the state level. Beaufort additionally records the lowest average travel time of any county in South Carolina - 28.7 minutes.
Congestion runs 66% higher than the state level, at a ratio of 30.2%, which means more pronounced congestion - expect markedly slower peak-hour deliveries and unreliable arrival times.
| Traffic | vehicles per day18,319 |
|---|---|
| Trucks | 6.5% |
| Average travel time | 31.4 min |
| Congestion ratio | 47.0% |
| Drivers’ average age | 53.2 yrs |
| Drivers’ average income | $92,907 |
Highways carry about half of all travel in Beaufort County, South Carolina, 53% of vehicle-miles. The average highway carries 18,319 vehicles per day, 70% more than the average non-highway road in the same area, which carries 10,775 vehicles per day.
With 39% of the road miles (123 miles in 1,058 segments), highways punch above their length, carrying 2,024,485 vehicle-miles traveled per day (≈739 million per year).
By highway travel volume, Beaufort outranks 74% of counties in South Carolina.
Highway truck concentration here runs 53% lower than the state average, at 6.5%. Highways here carry mainly commuter and local trips, with little through freight.
By truck concentration, highways here trail 98% of counties in South Carolina. By raw truck volume, Beaufort carries fewer highway trucks than 69% of counties in South Carolina.
| Traffic | vehicles per day10,775 |
|---|---|
| Trucks | 3.9% |
| Average travel time | 28.0 min |
| Congestion ratio | 25.6% |
| Drivers’ average age | 51.5 yrs |
| Drivers’ average income | $86,235 |
Local roads carry about half of all travel in Beaufort County, South Carolina, 47% of vehicle-miles. A typical local road sees 10,775 vehicles per day.
Spread over 193 miles and 3,860 segments, 61% of the road network, local roads carry a lighter load per mile: 1,785,976 vehicle-miles traveled per day (≈652 million per year). Trucks make up 3.9% of non-highway traffic, about 1 in 26 vehicles.
Non-highway roads carry a truck concentration that's 40% lower than the highway network.
The non-highway congestion ratio of 25.6% is 52% higher than the state level, suggesting slower local mobility than the state average.
Beaufort's average driver income is higher than 96% of counties in South Carolina. Beaufort's median driver age is higher than 93% of counties in South Carolina.
Beaufort County's biggest difference from the South Carolina average is its average daily traffic per road, 76% above it. Its highway truck share, by contrast, is 53% below.
| Metric | Beaufort County | South Carolina average | Difference |
|---|---|---|---|
| Traffic | 12,398 | 7,040 | +76.1% |
| Truck % (Total Traffic) | 5.3% | 9.5% | -44.3% |
| Truck % (Highway) | 6.5% | 13.7% | -52.6% |
| Avg. Travel Time | 28.7 min | 33.3 min | -13.7% |
Against the 4 nearest areas, Beaufort County is 127.8% more congested and carries 133.1% more traffic on a typical road; it has the busiest roads of the five. It is where traffic concentrates in this corner of the map - the local bottleneck, with more vehicles per road AND less room to absorb them.
| Area | Average daily traffic | Truck share | Daily vehicle-miles | Average travel time | Congestion ratio |
|---|---|---|---|---|---|
| Beaufort County | 12,398 | 5.3% | 3,810,461 | 28.7 min | 30.2% |
| Jasper County, South Carolina | 6,104 | 15.8% | 3,102,265 | 36.7 min | 15.9% |
| Colleton County, South Carolina | 3,724 | 15.3% | 2,450,385 | 35.0 min | 10.0% |
| Hampton County, South Carolina | 2,788 | 15.9% | 809,413 | 32.2 min | 8.1% |
| Chatham County, Georgia | 8,661 | 9.2% | 7,858,595 | 32.6 min | 19.0% |
| South Carolina average | 7,040 | 9.5% | N/A | 33.3 min | 18.2% |
Beaufort County sits in South Carolina's top three on average daily traffic volume and average driver income.
| Measure | Beaufort County | South Carolina rank |
|---|---|---|
| Traffic volume (AADT) | 12,398 | #2 of 46 |
| Highway vehicle-miles per day | 2,024,485 | #12 of 43 |
| Truck share on highways | 6.5% | #42 of 43 |
| Highway trucks per day | 1,189 | #30 of 43 |
| Average travel time | 28.7 min | #46 of 46 |
| Average driver income | $89,268 | #3 of 46 |
| Average driver age | 52.5 yrs | #4 of 46 |
Beaufort County ranks #2 of 46 on average daily traffic volume but #46 of 46 on average travel time. Heavy traffic and short trips together: a compact network where destinations sit close to one another.
Traffic concentrates on a few corridors: the three busiest roads average 50,254 vehicles a day, against 12,398 on the average road in Beaufort County.
William Hilton Parkway leads with 58,765 vehicles a day, 2,799 of them trucks (4.8%). It tops the truck ranking too, with the most trucks.
Trips using Charleston Highway are long: a median of 62.5 minutes against 28.7 county-wide, the mark of a through route.
Trucks make up 11.5% of traffic on Charleston Highway, against 5.3% across all roads in the county.
Drivers on Charleston Highway come from neighborhoods with an average household income of $61,433, 31% below the county average of $89,268.
Travel on William Hilton Parkway's busiest stretch runs 67% over free-flow time, against 30% across the county, so expect slower peak hours.
Fording Island Road peaks at 54,723 vehicles a day, 4.4 times the county average; trucks are 4.9% of it, below the county-wide 5.3%.
Independence Boulevard carries 3.0 times the county average at its busiest, 2,267 of them trucks (6.1%, above the county-wide 5.3%).
Okatie Highway is one of the more congested roads here: trips take 62% longer than at free-flow speed, against 30% county-wide.
Pope Avenue carries 2.6 times the county average on its busiest stretch, where the median trip lasts 24.6 minutes.
Charleston Highway carries 68% more than the county average at its busiest, 2,401 of them trucks (11.5%, above the county-wide 5.3%).
The average monitored road in Beaufort carries 12,398 vehicles per day, 76% more than the South Carolina average of 7,040.
Yes - at 28.7 minutes, Beaufort has the lowest average travel time of any county in South Carolina.
Drivers on Beaufort roads have a median age of 52 years, older than the South Carolina average of 46, and the median household income of the neighborhoods trips originate from averages $89,268, 21% above the South Carolina average.
Weekday traffic has two busy windows: AM peak 10:00 AM–12:00 PM and PM peak 4:00 PM–6:00 PM - about 75% above the daily average.
The average trip in Beaufort takes 28.7 minutes, 14% shorter than the South Carolina average of 33.3 minutes, delays at signals and congestion included.
Trucks make up about 5.3% of all traffic in Beaufort County, South Carolina, rising to 6.5% on highways, where long-haul freight concentrates.
William Hilton Parkway carries the most, 58,765 vehicles per day on its busiest stretch, followed by Fording Island Road (54,723), Independence Boulevard (37,272), Okatie Highway (35,865), Pope Avenue (32,234). Figures are AADT, both directions combined.
William Hilton Parkway, with about 2,799 trucks per day on its busiest stretch, 4.8% of its 58,765 vehicles.
About 58,765 vehicles per day in both directions on its busiest stretch, including 2,799 trucks (4.8%). Traffic is lower on its quieter stretches; TrafficZoom shows the count for every segment.

Mobile device location data (anonymized and aggregated)

Road sensor networks and traffic counters

Historical traffic pattern databases
The same traffic breakdown for the areas closest to Beaufort County, South Carolina.
Identify traffic patterns street by street and analyze the exact corridors that matter to your project.
