
Need segment-level traffic data?
Identify traffic patterns street by street and analyze the exact corridors that matter to your project.
Average daily traffic, vehicle-miles traveled and truck share for 1.2 million miles of U.S. road across all 50 states and the District of Columbia.
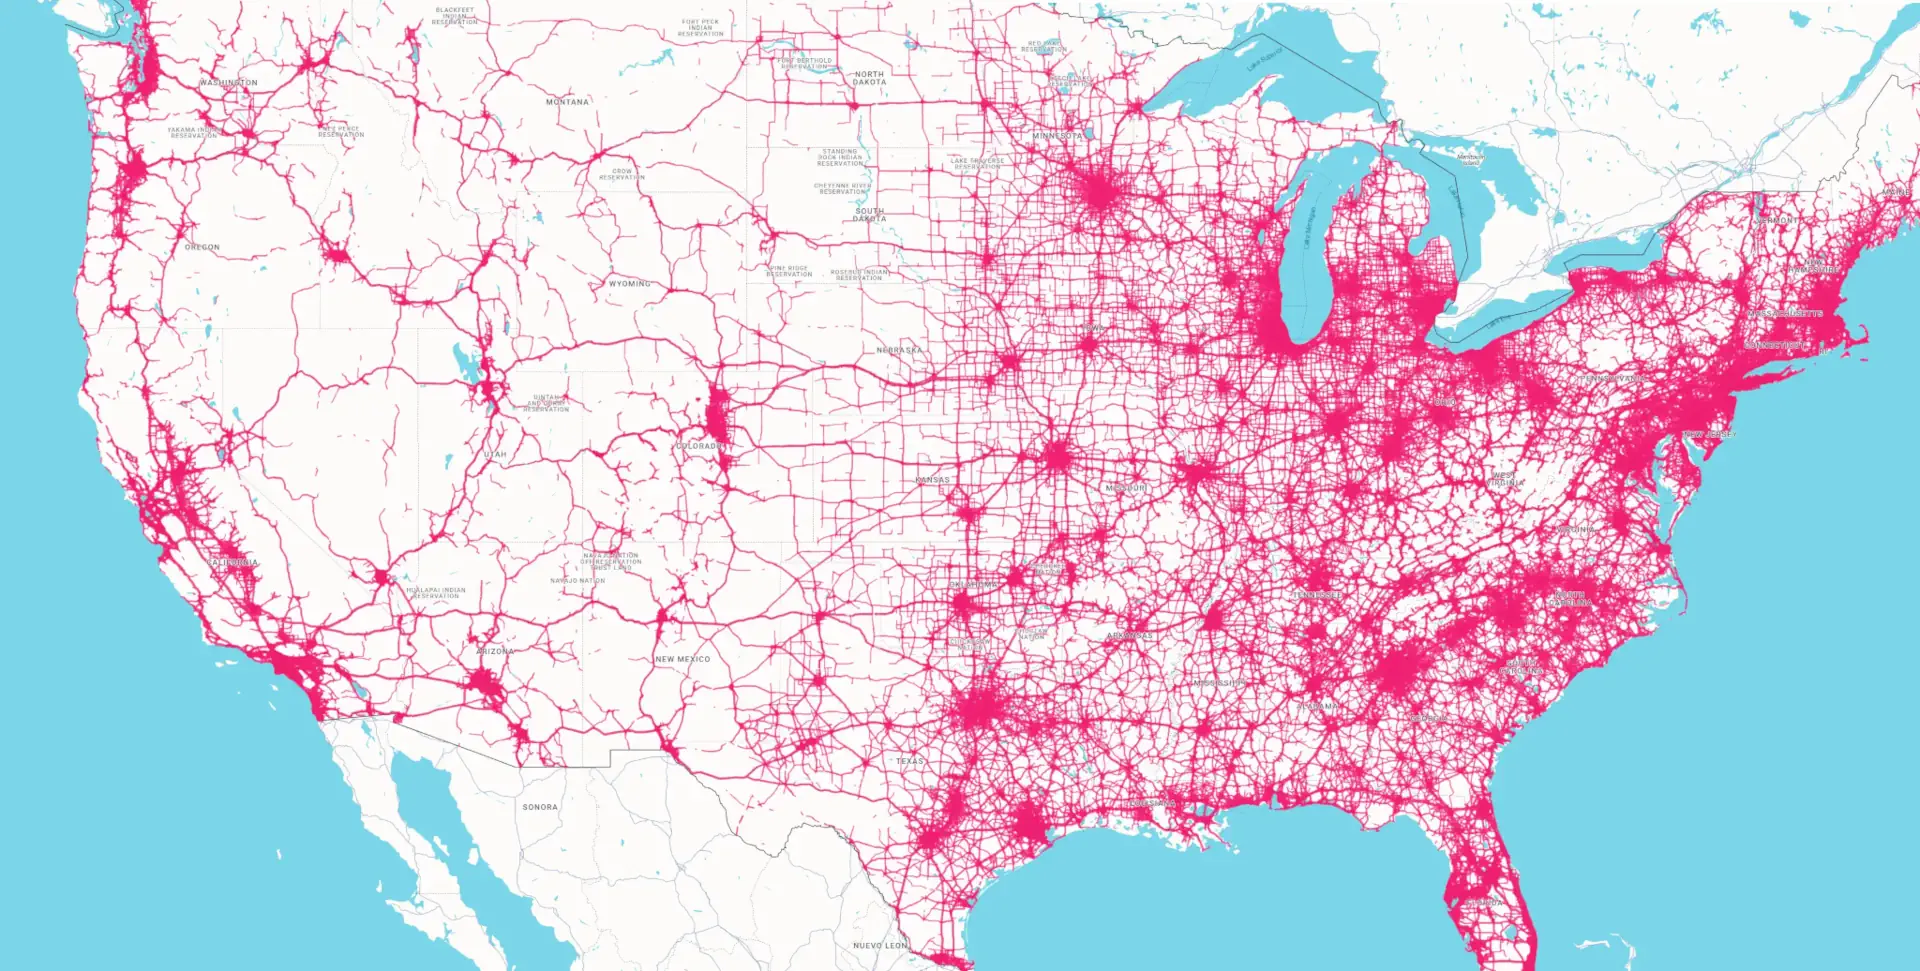
TrafficZoom measures traffic on 1.2 million miles of U.S. road across 3,142 counties in all 50 states and the District of Columbia. Together those roads carry 7,593,806,071 vehicle-miles traveled per day (≈2.8 trillion per year), and a typical road segment sees 6,986 vehicles per day. Every figure below is measured from anonymized vehicle movement, not modelled from a station count, and each state and county has its own page with the same breakdown.
Road network
Highways carry the country's long-distance and freight traffic on 21.3% of the measured network. The average highway carries 15,210 vehicles per day, 139% more than the average non-highway road, which carries 6,361. Because there are so many more local roads, the two classes end up moving almost the same amount of traffic: highways account for 50.5% of daily vehicle-miles and non-highway roads for 49.5%. Trucks are the sharpest difference between them: 13.1% of highway travel against 5.6% on local roads.
| Metric | All roads | Highways | Non-highway roads |
|---|---|---|---|
| Average daily traffic (AADT) vehicles per day on a typical road | 6,986 | 15,210 | 6,361 |
| Daily vehicle-miles traveled total travel carried per day | 7,593,806,071 | 3,836,186,576 | 3,757,619,511 |
| Annual vehicle-miles traveled daily travel x 365 | 2.8 trillion | 1.4 trillion | 1.4 trillion |
| Truck share share of vehicle-miles driven by trucks | 9.3% | 13.1% | 5.6% |
| Daily truck-miles vehicle-miles driven by trucks | 710,020,868 | 501,389,585 | 208,923,645 |
| Road miles measured centerline miles | 1,223,095 | 261,076 | 962,020 |
| Road segments individually measured stretches of road | 19,817,981 | 1,400,989 | 18,416,992 |
| Average travel time median trip length in time | 33.3 min | 39.4 min | 33.0 min |
| Congestion ratio volume against capacity | 18.9% | 39.5% | 18.3% |
| Drivers' average age median age at the trip origin | 45.5 yrs | 46.0 yrs | 45.4 yrs |
| Drivers' average income median household income at the origin | $91,418 | $91,103 | $91,783 |
"All roads" is every measured segment recombined into a single figure, including the ramps and service roads that belong to neither of the other two classes - which is why it is not the sum, or the midpoint, of the two columns beside it. Travel time and driver age are medians.
State league table
Ranked by vehicle-miles traveled per day - the amount of driving a state's roads actually carry, rather than how busy any single road is. California leads the country with 927,539,301 vehicle-miles per day, 12.2% of all U.S. travel measured by TrafficZoom.
| State | Daily vehicle-miles | Annual vehicle-miles | Share of U.S. total |
|---|---|---|---|
| 1. California | 927,539,301 | 339 billion | 12.2% |
| 2. Texas | 735,449,278 | 268 billion | 9.7% |
| 3. Florida | 524,298,426 | 191 billion | 6.9% |
| 4. Georgia | 279,644,557 | 102 billion | 3.7% |
| 5. North Carolina | 273,243,430 | 99.7 billion | 3.6% |
Freight
Truck share is the percentage of vehicle-miles driven by trucks, so it measures how freight-heavy a state's traffic mix is rather than how many trucks it has. Wyoming tops the country at 17.9%, against 9.3% nationally. The states that rank highest are the ones long-haul corridors cross without much local traffic to dilute them.
| State | Truck share of traffic | Truck share on highways | Daily truck-miles | Average daily traffic | Road miles |
|---|---|---|---|---|---|
| 1. Wyoming | 17.9% | 23.3% | 3,907,767 | 3,650 | 8,810 |
| 2. New Mexico | 16.2% | 22.2% | 10,421,941 | 4,562 | 15,186 |
| 3. Indiana | 12.1% | 19.6% | 19,361,350 | 5,704 | 27,660 |
| 4. Kentucky | 12.1% | 15.9% | 14,315,575 | 4,696 | 27,673 |
| 5. Montana | 11.7% | 15.0% | 3,322,092 | 4,202 | 11,058 |
County league table
The same two rankings one level down, across every county TrafficZoom publishes. The two lists have almost nothing in common: the busiest counties are metropolitan - Los Angeles County, California alone carries 2.7% of all U.S. travel - while the most truck-dominated are rural counties on interstate freight corridors.
| County | Daily vehicle-miles | Annual vehicle-miles | Share of U.S. total | Average daily traffic |
|---|---|---|---|---|
| 1. Los Angeles County, California | 204,530,094 | 74.7 billion | 2.7% | 19,000 |
| 2. Harris County, Texas | 107,067,377 | 39.1 billion | 1.4% | 10,080 |
| 3. Maricopa County, Arizona | 98,058,205 | 35.8 billion | 1.3% | 11,870 |
| 4. San Diego County, California | 85,105,406 | 31.1 billion | 1.1% | 14,311 |
| 5. Riverside County, California | 71,474,673 | 26.1 billion | 0.9% | 12,881 |
| County | Truck share of traffic | Truck share on highways | Daily truck-miles | Average daily traffic | Road miles |
|---|---|---|---|---|---|
| 1. Oldham County, Texas | 42.7% | 48.3% | 380,069 | 2,465 | 206 |
| 2. Hudspeth County, Texas | 41.8% | 42.1% | 633,205 | 3,096 | 276 |
| 3. Culberson County, Texas | 40.2% | 42.8% | 424,159 | 2,213 | 294 |
| 4. Quay County, New Mexico | 38.9% | 41.1% | 577,415 | 1,869 | 407 |
| 5. Hidalgo County, New Mexico | 35.8% | 37.9% | 249,761 | 2,774 | 159 |
Truck share runs from 35.8% to 42.7% in these counties, 5 times the national 9.3%. They are not busy places: a typical road in them carries 2,483 vehicles per day against 6,986 nationally. That is the whole mechanism - the interstate freight is there, the local car traffic is not, so trucks make up a far larger share of a much smaller total. It is also why truck share and traffic volume rank almost disjoint sets of counties, and why a site-selection question about freight should be asked of truck share, while one about customer flow should be asked of volume.
Time of day and season
Traffic builds to a morning peak between 7:00 AM and 9:00 AM and an afternoon peak between 3:00 PM and 7:00 PM, the busier of the two. Weekend traffic runs 16% below the weekday average. Volumes are highest from June to August, 4% above the annual average. January is the quietest month of the year, 9% below it.
Share of an average day's traffic by hour, nationwide. Each state and county page carries the same curve for its own roads.
Data source
TrafficZoom derives traffic volumes from anonymized vehicle movement, map-matched to the road network segment by segment and scaled to full traffic using observed penetration rates. The national figures on this page are the roll-up of 3,142 county measurements covering 19,817,981 road segments; 2,717 of them have enough coverage for a page of their own.
Average daily traffic is the mean over measured road segments, and vehicle-miles traveled is measured directly as volume times segment length rather than inferred from the two. Travel time and driver age are medians; driver income is the average median household income of the neighborhoods trips start from. Truck share is the share of vehicle-miles driven by trucks. Highways cover interstates, freeways and primary arterials; non-highway roads cover everything else that carries measurable traffic.
Driver demographics - age and income - come from the U.S. Census Bureau's American Community Survey 5-year estimates, joined to the block groups the trips on a road actually start from, so they describe the people driving a road rather than the people living beside it. For deeper demographic analysis of an area, see interactive-map-ai.com.
Modelled volumes are calibrated and cross-checked against the physical traffic counts published by state departments of transportation and the U.S. Department of Transportation, so every road carries a number traceable to a counted one nearby. The road network itself comes from OpenStreetMap.
TrafficZoom is built on work Ticon has been doing with transportation data since 2016.
A typical measured U.S. road segment carries 6,986 vehicles per day. Across the whole network that adds up to 7,593,806,071 vehicle-miles traveled per day (≈2.8 trillion per year).
California carries the most traffic of any state, at 927,539,301 vehicle-miles per day - 12.2% of all U.S. travel measured by TrafficZoom.
Trucks account for 9.3% of all vehicle-miles driven nationally, rising to 13.1% on highways and falling to 5.6% on non-highway roads. Wyoming is the most freight-heavy state at 17.9%.
Highways are 21.3% of the measured road network but carry 50.5% of daily vehicle-miles, because the average highway carries 15,210 vehicles per day against 6,361 on the average local road.
Weekday traffic peaks between 7:00 AM and 9:00 AM in the morning and between 3:00 PM and 7:00 PM in the afternoon. Weekend volumes run 16% below the weekday average. January is the quietest month of the year.
Volumes are measured from anonymized vehicle movement, map-matched to individual road segments and scaled using observed penetration rates - not modelled from a handful of permanent count stations. This page rolls up 3,142 counties across all 50 states and the District of Columbia, covering 19,817,981 road segments.
Identify traffic patterns street by street and analyze the exact corridors that matter to your project.
Browse by state
Each state page carries the same breakdown as this one - AADT, vehicle-miles, truck share, congestion, travel time and driver demographics - plus a ranking of its own counties.

