
Need segment-level traffic data?

Identify traffic patterns street by street and analyze the exact corridors that matter to your project.
Get insights →
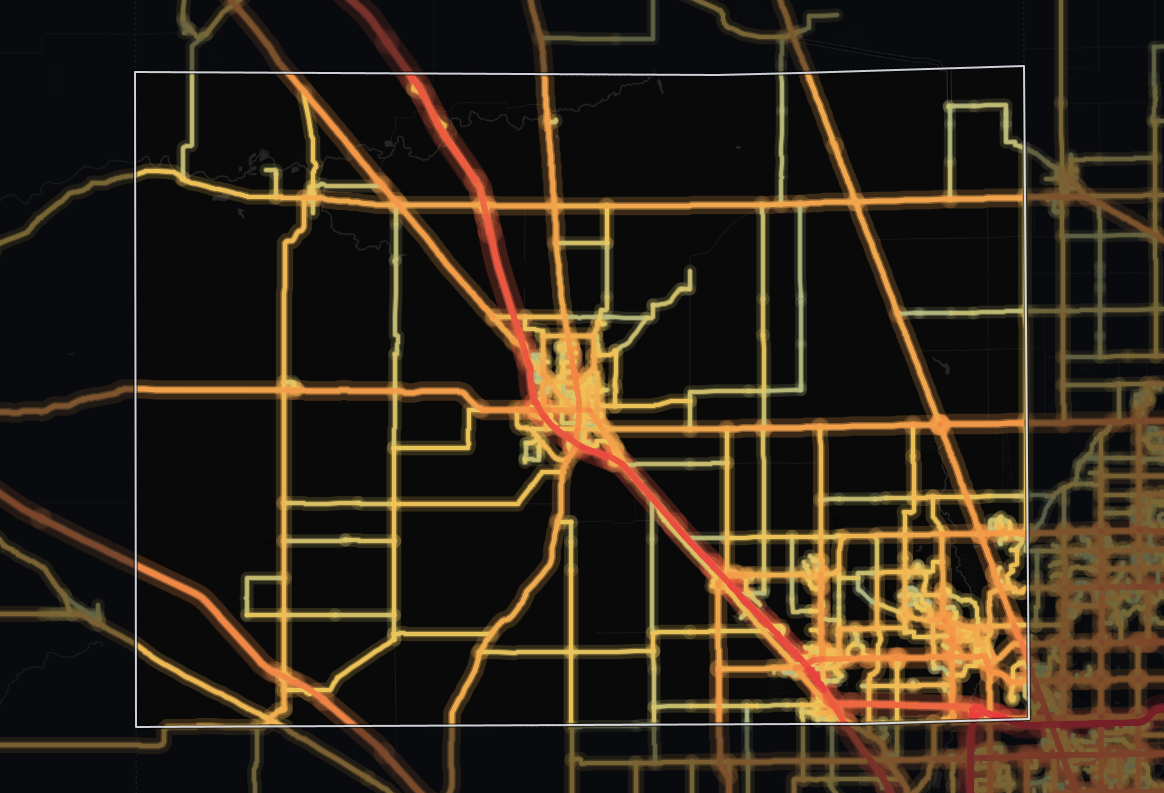
Traffic heat map of Boone County, Indiana: 379 miles of roads shaded from blue (light) to red (heavy traffic), busiest on I 465 and I 65

Boone County, Indiana Traffic Counts

Traffic analytics for Boone County, Indiana, calculated from real-world mobile and sensor networks on 6,556 road segments (379 road miles, about 305 ft each). Its highways rank among the top 5 counties in Indiana for trucks per day. Use the figures below to move from assumptions to certainty on retail locations, logistics and road planning.
Data sourced from TrafficZoom's proprietary analytics platform.
Data current as of:
Q3 2026
Updated:
September 29, 2026
Find my place
total traffic icon

Total Traffic Volume & Performance in Boone County, Indiana

Traffic

The average number of vehicles that travel each day over any road in the road network.

vehicles per day4,804
Trucks

The percentage of the total traffic volume composed of heavy vehicles.

17.6%
Average travel time

The average time of travel averaged among all vehicles traveling on the road network.

34.5 min
Congestion ratio

The rate at which the actual travel time exceeds free-flow travel time, averaged among all roads in the network.

15.5%
Drivers’ average age

Average age of residents in the geographic areas where the vehicle trips originated.

44.5 yrs
Drivers’ average income

Average income of residents in the geographic areas where the vehicle trips originated.

$104,358

The average monitored road in Boone County, Indiana carries 4,804 vehicles per day. Across its 379 miles of monitored roads, that adds up to 2,757,851 vehicle-miles traveled per day (≈1.0 billion per year). Trucks are 17.6% of traffic, more than the 12.1% across Indiana.

Busier roads than 69% of counties in Indiana

Boone sees 16% lower average daily traffic volume than the state average (4,804 vehicles per day against 5,704), suggesting less demand on each road - a factor worth weighing in site selection and logistics planning. In total volume terms, its road network carries about 1.7% of Indiana's statewide total of vehicle-miles. 69% of counties in Indiana see less traffic than Boone's 4,804 vehicles per day.

Journey times here (34.5 minutes on average) closely track the state level. 59% of counties in Indiana have a shorter average travel time than Boone's 34.5 minutes.

At 15.5%, the congestion ratio matches the state level closely.

Highway vs. Non-Highway Traffic Analysis

highway traffic icon

Highway Traffic in Boone County, Indiana

Trafficvehicles per day24,803
Trucks24.6%
Average travel time51.5 min
Congestion ratio65.0%
Drivers’ average age43.9 yrs
Drivers’ average income$93,231

A little more than half of the driving in Boone County, Indiana happens on highways: 61% of all vehicle-miles. The average highway carries 24,803 vehicles per day, 474% more than the average non-highway road in the same area, which carries 4,323 vehicles per day.

Yet highways are only 20% of the road network, 75 miles in 154 segments, so each mile of them is 3.1 times as busy as the average road mile.

That is more highway travel volume than 90% of counties in Indiana.

More highway trucks than 95% of counties in Indiana

At 24.6%, highway truck share is 26% higher than the state average. Highways here lean toward freight, so highway access is a real asset for logistics operators.

By truck concentration, highways here outrank 69% of counties in Indiana. Boone's highway truck count is higher than 95% of counties in Indiana, at roughly 6,104 trucks per day.

non-highway traffic icon

Non-highway Traffic in Boone County, Indiana

Trafficvehicles per day4,323
Trucks6.7%
Average travel time34.1 min
Congestion ratio14.3%
Drivers’ average age45.5 yrs
Drivers’ average income$111,193

A significant share of driving in Boone County, Indiana, 39% of vehicle-miles, happens on local roads. The average non-highway road carries 4,323 vehicles per day.

Local roads make up 80% of the monitored road miles (304 miles in 6,402 segments) but carry less than their share of travel: 1,072,181 vehicle-miles traveled per day (≈391 million per year). Trucks make up 6.7% of non-highway traffic, about 1 in 15 vehicles.

Drivers from higher-income areas than 99% of counties in Indiana

Compared to highways, non-highway routes see 73% fewer trucks by share.

Non-highway congestion (14.3%) runs slightly lower than the state level (6% lower).

99% of counties in Indiana see lower average driver income among trip origins than Boone. Boone's median driver age is lower than 92% of counties in Indiana.

Time-of-Day & Seasonal Patterns

Data Finding: Hourly & Seasonal Patterns

In Boone County, Indiana, the peak hour concentrates about 8% of the day's traffic.

Boone County vs. Indiana Traffic Comparison

The truck share sets Boone County apart: 46% above the Indiana average. Its highway truck share is also 26% above.

MetricBoone CountyIndiana averageDifference
Traffic4,8045,704-15.8%
Truck % (Total Traffic)17.6%12.1%+45.7%
Truck % (Highway)24.6%19.6%+25.7%
Avg. Travel Time34.5 min33.5 min+3.0%

How Boone County compares

Boone County against nearby counties

Boone County tracks the 4 areas around it closely - no measure in this table sets it far apart from the areas immediately next to it, though it has the third busiest roads of the five. Traffic volume here matches the areas around it, but more of that traffic is trucks - a difference in what routes through, not in how much.

Boone County and the 4 nearest county-level areas by centroid distance, with the Indiana average for scale.
AreaAverage daily trafficTruck shareDaily vehicle-milesAverage travel timeCongestion ratio
Boone County4,80417.6%2,757,85134.5 min15.5%
Clinton County, Indiana4,10318.3%1,251,30237.7 min12.1%
Hamilton County, Indiana7,3926.0%7,300,63529.9 min20.8%
Hendricks County, Indiana6,88410.6%3,649,73432.7 min17.5%
Montgomery County, Indiana3,99517.0%1,037,19335.4 min10.3%
Indiana average5,70412.1%N/A33.5 min15.6%

Boone County ranked within Indiana

On average driver income, Boone County is among the three highest county-level areas in Indiana.

Boone County ranked among 92 county-level areas in Indiana (1 = highest); measures without data in every county rank a smaller field, down to 79.
MeasureBoone CountyIndiana rank
Traffic volume (AADT)4,804#29 of 92
Highway vehicle-miles per day1,685,670#9 of 79
Truck share on highways24.6%#25 of 79
Highway trucks per day6,104#5 of 79
Average travel time34.5 min#38 of 92
Average driver income$104,358#2 of 92
Average driver age44.5 yrs#85 of 92

Boone County ranks #2 of 92 on average driver income but #85 of 92 on average driver age - the two describe the same roads and are worth reading together rather than either on its own.

Busiest roads in Boone County, Indiana

The three busiest roads in Boone County average 59,761 vehicles a day, 12.4 times the county average of 4,804 across all its monitored roads.

I 465 leads with 80,745 vehicles a day, 9,128 of them trucks (11.3%). I 65 carries the most trucks, 15,203 a day (23.7% of its traffic), although it ranks #2 for all traffic.

I 65 carries longer journeys than most roads here, with a median trip of 57.9 minutes against 34.5 county-wide.

Freight stands out on I 74: trucks are 28.0% of the traffic there, against 17.6% county-wide.

Drivers on Whitestown Parkway come from neighborhoods with an average household income of $130,489, 25% above the county average of $104,358.

Ranked by daily traffic (AADT)

Cars and light vehiclesTrucks
1I 465Motorway · 80,745vehicles9,128trucks · 11.3%
Road class
Motorway
Congestion ratio
97.9%
Median trip time
39.0 min
Drivers’ median age
44.1 yrs
Drivers’ average income
$113,780

Delays build on I 465: its congestion ratio of 98% over free-flow time is well above the county's 15%.

2I 65Motorway · 64,209vehicles15,203trucks · 23.7%
Road class
Motorway
Congestion ratio
60.2%
Median trip time
57.9 min
Drivers’ median age
43.6 yrs
Drivers’ average income
$88,603

Travel on I 65's busiest stretch runs 60% over free-flow time, against 15% across the county, so expect slower peak hours.

3I 865Motorway · 34,329vehicles6,457trucks · 18.8%
Road class
Motorway
Congestion ratio
51.7%
Median trip time
46.4 min
Drivers’ median age
44.3 yrs
Drivers’ average income
$109,016

At 7.1 times the county average, I 865 draws drivers from neighborhoods averaging $109,016 in household income.

4Whitestown ParkwaySecondary road · 17,692vehicles536trucks · 3.0%
Road class
Secondary road
Congestion ratio
47.0%
Median trip time
27.2 min
Drivers’ median age
45.3 yrs
Drivers’ average income
$130,489

Whitestown Parkway peaks at 17,692 vehicles a day, 3.7 times the county average; trucks are 3.0% of it, below the county-wide 17.6%.

5I 74Motorway · 14,456vehicles4,048trucks · 28.0%
Road class
Motorway
Congestion ratio
16.6%
Median trip time
57.4 min
Drivers’ median age
47.4 yrs
Drivers’ average income
$80,382

I 74 carries through traffic: the median trip using it lasts 57.4 minutes, against 34.5 for the county.

Ranked by trucks per day

Cars and light vehiclesTrucks
1I 65Motorway · #2 by traffic64,209vehicles15,203trucks · 23.7%
2I 465Motorway · #1 by traffic80,745vehicles9,128trucks · 11.3%
3I 865Motorway · #3 by traffic34,329vehicles6,457trucks · 18.8%
4I 74Motorway · #5 by traffic14,456vehicles4,048trucks · 28.0%
5US 52Primary road · 9,004vehicles905trucks · 10.1%
Road class
Primary road
Congestion ratio
8.9%
Median trip time
48.8 min
Drivers’ median age
42.9 yrs
Drivers’ average income
$79,374

Drivers on US 52 are on long journeys, a median 48.8 minutes against 34.5 county-wide: a through route more than a local street.

How to read these road counts
  • The first number is AADT, annual average daily traffic: the vehicles passing a point on an average day, both directions combined and trucks included. On a divided highway both carriageways are added together.
  • Traffic changes along a road, with more near interchanges and towns and less in open country. Every figure for a road describes its busiest stretch in the county, so the two rankings show the same numbers for the same road.
  • The second number is the trucks on that stretch, a part of its AADT. The bar splits the AADT into cars and light vehicles (blue) and trucks (amber).
  • See segment-level AADT for any road on TrafficZoom.

Data Sources & Methodology

The data presented on this page is derived from TrafficZoom's proprietary analytics platform, which aggregates and normalizes information from multiple sources, including:

Mobile device location data (anonymized and aggregated)

Road sensor networks and traffic counters

Historical traffic pattern databases

Public traffic count programs published by the

BooneDepartment of Transportation

Demographic Baseline for O-D Modeling

U.S. Census Bureau
All metrics represent estimates based on statistical modeling and are intended for strategic planning purposes.
link arrow icon
Data current as of:
Q3 2026

Explore further

TrafficZoom platform

— street-level analytics and custom corridor reports.

Map AI

— demographics, housing and mobility data.

Counties near Boone County

The same traffic breakdown for the areas closest to Boone County, Indiana.

Need segment-level traffic data?

Identify traffic patterns street by street and analyze the exact corridors that matter to your project.
