
Need segment-level traffic data?
Identify traffic patterns street by street and analyze the exact corridors that matter to your project.
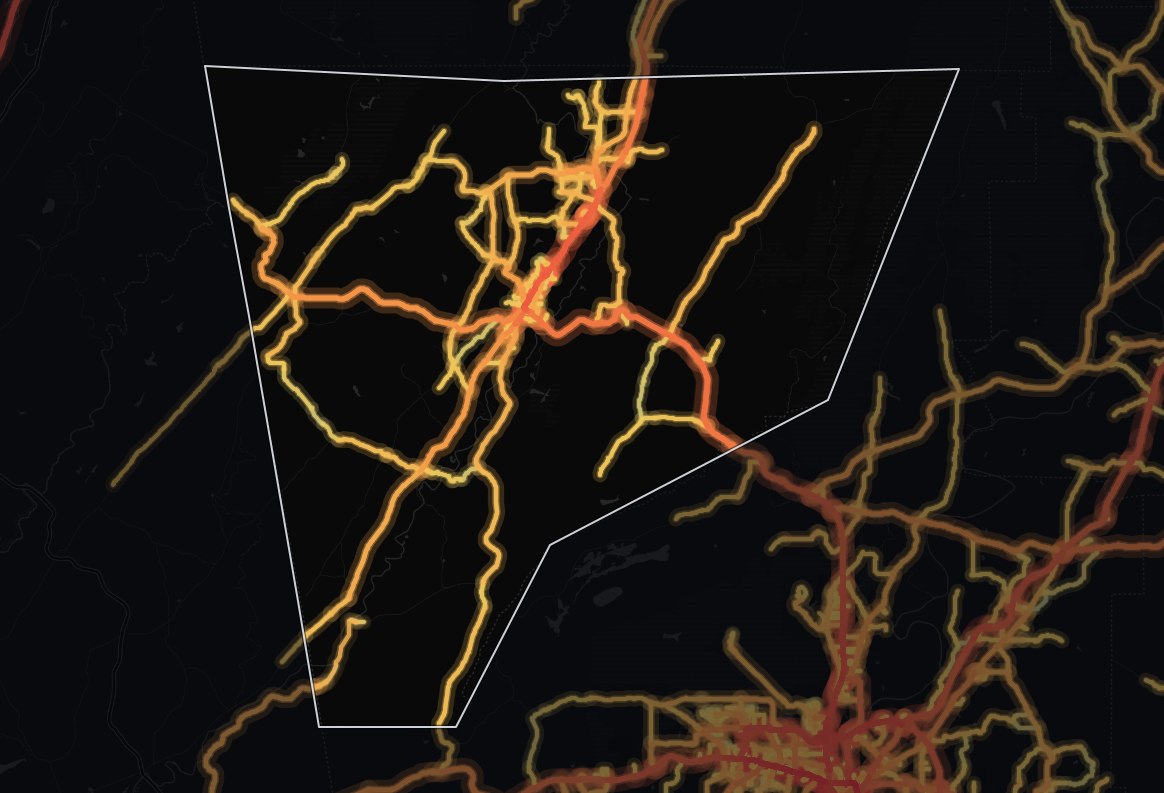
Traffic | vehicles per day4,161 |
|---|---|
Trucks | 7.7% |
Average travel time | 31.0 min |
Congestion ratio | 10.2% |
Drivers’ average age | 48.8 yrs |
Drivers’ average income | $52,679 |
The average monitored road in Chattooga County, Georgia carries 4,161 vehicles per day. Across its 161 miles of monitored roads, that adds up to 421,368 vehicle-miles traveled per day (≈154 million per year). About 1 in 13 vehicles is a truck, fewer than the 1 in 10 across Georgia.
Chattooga's average daily traffic volume is 44% lower than the state average - 4,161 vehicles per day against 7,398 - suggesting less traffic load per road - lighter roads for freight, but less passing trade for roadside retail. Network-wide, Chattooga accounts for about 0.2% of Georgia's statewide total of vehicle-miles. 57% of counties in Georgia see less traffic than Chattooga's 4,161 vehicles per day.
Journey times run 8% lower than the state level, at 31.0 minutes on average. 82% of counties in Georgia have a longer average travel time than Chattooga's 31.0 minutes.
At 39% lower than the state level, the 10.2% congestion ratio signals smoother traffic flow - fewer delays make delivery windows more reliable.
| Traffic | vehicles per day11,815 |
|---|---|
| Trucks | 8.7% |
| Average travel time | 33.3 min |
| Congestion ratio | 23.0% |
| Drivers’ average age | 48.8 yrs |
| Drivers’ average income | $53,050 |
Travel in Chattooga County, Georgia splits roughly evenly, with about half of it (52% of vehicle-miles) on highways. The average highway carries 11,815 vehicles per day, 481% more than the average non-highway road in the same area, which carries 2,034 vehicles per day.
That comes from just 16% of the monitored road miles: 26 miles in 334 segments, carrying 220,099 vehicle-miles traveled per day (≈80.3 million per year).
The concentration of trucks on highways (8.7%) is 36% lower than the state average for similar road classifications. Highways here mostly serve passenger trips, so local access matters more than long-haul routing for logistics operators.
Chattooga's highway truck share (8.7%) is lower than 89% of counties in Georgia. 55% of counties in Georgia see more highway trucks per day than Chattooga's roughly 1,022.
| Traffic | vehicles per day2,034 |
|---|---|
| Trucks | 6.6% |
| Average travel time | 30.3 min |
| Congestion ratio | 6.6% |
| Drivers’ average age | 49.3 yrs |
| Drivers’ average income | $52,105 |
Travel in Chattooga County, Georgia splits roughly evenly, with about half of it (48% of vehicle-miles) on local roads. The average non-highway road carries 2,034 vehicles per day.
Local roads make up 84% of the monitored road miles (135 miles in 1,202 segments) but carry less than their share of travel: 201,270 vehicle-miles traveled per day (≈73.5 million per year). About 1 in 15 vehicles on non-highway roads is a truck (6.6%).
Compared to highways, non-highway routes see 24% fewer trucks by share.
The non-highway congestion ratio of 6.6% is 59% lower than the state level, suggesting more efficient local mobility than the state average.
Chattooga's average driver income is lower than 88% of counties in Georgia. Chattooga's median driver age is higher than 81% of counties in Georgia.

Mobile device location data (anonymized and aggregated)
Road sensor networks and traffic counters
Historical traffic pattern databases

Identify traffic patterns street by street and analyze the exact corridors that matter to your project.



