
Need segment-level traffic data?
Identify traffic patterns street by street and analyze the exact corridors that matter to your project.
Traffic | vehicles per day19,000 |
|---|---|
Trucks | 6.0% |
Average travel time | 37.1 min |
Congestion ratio | 33.4% |
Drivers’ average age | 43.4 yrs |
Drivers’ average income | $103,580 |
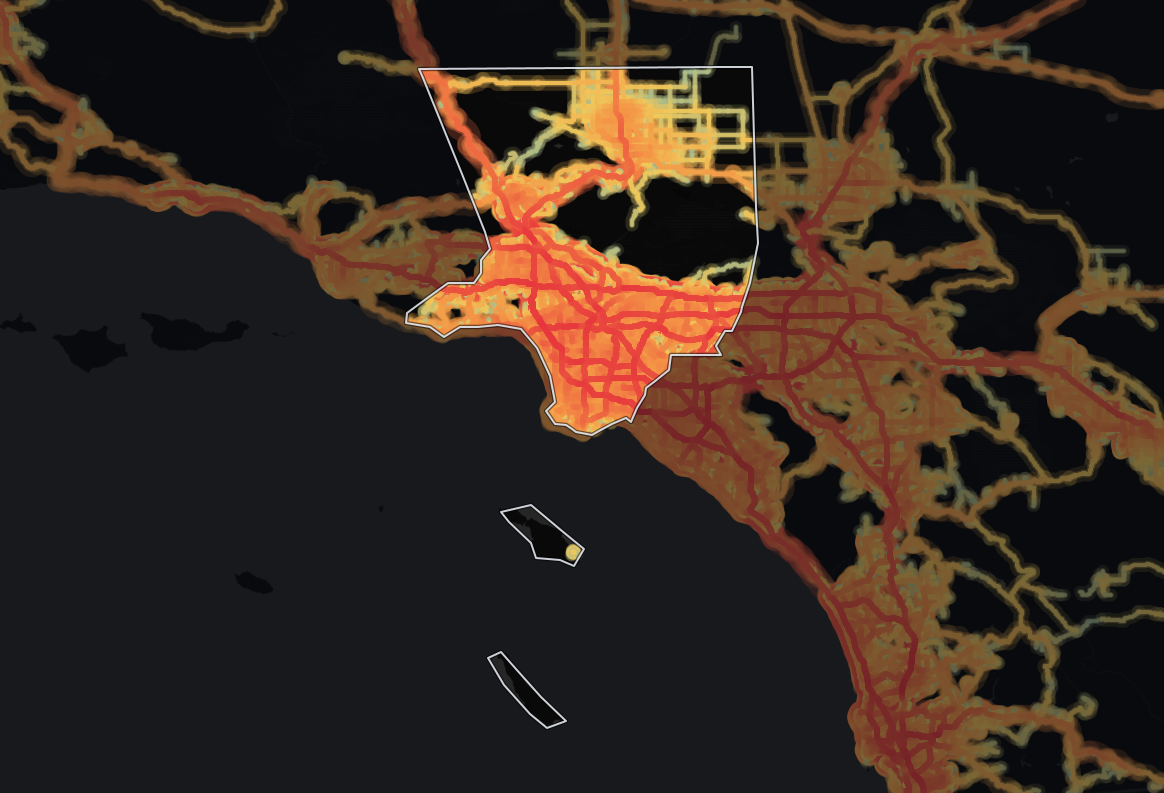
The average monitored road in Los Angeles County, California carries 19,000 vehicles per day. Across its 8,894 miles of monitored roads, that adds up to 204,530,094 vehicle-miles traveled per day (≈74.7 billion per year). About 1 in 17 vehicles is a truck, fewer than the 1 in 13 across California.
Los Angeles sees 49% higher average daily traffic volume than the state average (19,000 vehicles per day against 12,766), suggesting more demand on each road - more exposure for roadside businesses, and more competition for road space. Across the whole network, that travel is about 22% of California's statewide total. Los Angeles stands out as having the highest traffic volume in California - 19,000 vehicles per day.
Journey times run 7% higher than the state level, at 37.1 minutes on average. Its average travel time of 37.1 minutes is longer than 77% of counties in California.
Congestion runs 22% higher than the state level, at a ratio of 33.4%, which means more pronounced congestion - relevant for traffic control and delivery planning.
| Traffic | vehicles per day71,593 |
|---|---|
| Trucks | 7.4% |
| Average travel time | 42.9 min |
| Congestion ratio | 78.2% |
| Drivers’ average age | 43.0 yrs |
| Drivers’ average income | $107,170 |
Highways carry about half of all travel in Los Angeles County, California, 50% of vehicle-miles. The average highway carries 71,593 vehicles per day, 308% more than the average non-highway road in the same area, which carries 17,561 vehicles per day.
Yet highways are only 15% of the road network, 1,346 miles in 8,990 segments, so each mile of them is 3.3 times as busy as the average road mile.
By highway travel volume, Los Angeles ranks first in California.
At 7.4%, highway truck share is 29% lower than the state average. Trucks are a small share of a very large highway flow, so Los Angeles still moves heavy freight volumes alongside its passenger traffic.
By truck concentration, highways here trail 90% of counties in California. By raw truck volume, Los Angeles carries more highway trucks than 94% of counties in California.
| Traffic | vehicles per day17,561 |
|---|---|
| Trucks | 4.5% |
| Average travel time | 36.9 min |
| Congestion ratio | 32.2% |
| Drivers’ average age | 43.8 yrs |
| Drivers’ average income | $101,475 |
Local roads carry about half of all travel in Los Angeles County, California, 50% of vehicle-miles. A typical local road sees 17,561 vehicles per day.
Spread over 7,548 miles and 328,733 segments, 85% of the road network, local roads carry a lighter load per mile: 102,253,922 vehicle-miles traveled per day (≈37.3 billion per year). Trucks make up 4.5% of non-highway traffic, about 1 in 22 vehicles.
The concentration of trucks on non-highway roads is 39% lower than on highways.
The non-highway congestion ratio of 32.2% is 21% higher than the state level, suggesting slower local mobility than the state average.
Los Angeles's average driver income is higher than 63% of counties in California. 67% of counties in California have an older driver population than Los Angeles.


Mobile device location data (anonymized and aggregated)
Road sensor networks and traffic counters
Historical traffic pattern databases

Identify traffic patterns street by street and analyze the exact corridors that matter to your project.



