
Need segment-level traffic data?
Identify traffic patterns street by street and analyze the exact corridors that matter to your project.
TrafficThe average number of vehicles that travel each day over any road in the road network. | vehicles per day3,212 |
|---|---|
TrucksThe percentage of the total traffic volume composed of heavy vehicles. | 19.8% |
Average travel timeThe average time of travel averaged among all vehicles traveling on the road network. | 32.1 min |
Congestion ratioThe rate at which the actual travel time exceeds free-flow travel time, averaged among all roads in the network. | 9.8% |
Drivers’ average ageAverage age of residents in the geographic areas where the vehicle trips originated. | 45.3 yrs |
Drivers’ average incomeAverage income of residents in the geographic areas where the vehicle trips originated. | $63,773 |
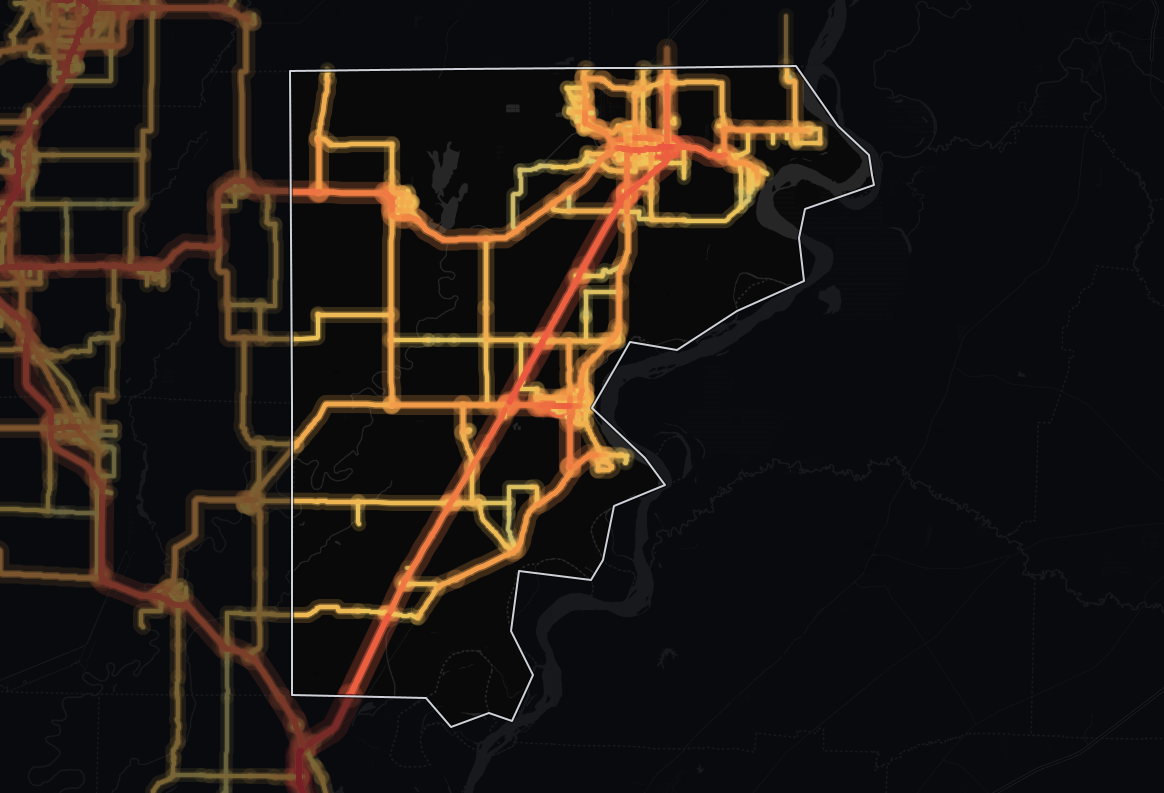
The average monitored road in Mississippi County, Arkansas carries 3,212 vehicles per day. Across its 536 miles of monitored roads, that adds up to 1,725,314 vehicle-miles traveled per day (≈630 million per year). Freight weighs heavily here: trucks are 19.8% of traffic, against 11.6% across Arkansas.
At 3,212 vehicles per day, the average monitored road in Mississippi carries 35% less traffic than the state average of 4,932, suggesting less demand on each road - less drive-by exposure for retail, but easier access for deliveries. In total volume terms, its road network carries about 1.9% of Arkansas's statewide total of vehicle-miles. 69% of counties in Arkansas see less traffic than Mississippi's 3,212 vehicles per day.
At 32.1 minutes, the average travel time matches the state level closely. 63% of counties in Arkansas have a longer average travel time than Mississippi's 32.1 minutes.
The congestion ratio of 9.8% is 23% lower, pointing to smoother traffic flow than the state level - crucial for traffic control improvement and logistics planning.
| Traffic | vehicles per day6,550 |
|---|---|
| Trucks | 33.1% |
| Average travel time | 51.7 min |
| Congestion ratio | 14.1% |
| Drivers’ average age | 45.6 yrs |
| Drivers’ average income | $60,700 |
A significant share of driving in Mississippi County, Arkansas, 43% of vehicle-miles, happens on highways. The average highway carries 6,550 vehicles per day, 110% more than the average non-highway road in the same area, which carries 3,123 vehicles per day.
Highways make up 18% of the monitored road miles (95 miles, 113 segments), so they carry more than their share: 747,128 vehicle-miles traveled per day (≈273 million per year).
That is more highway travel volume than 65% of counties in Arkansas.
Highway truck concentration here runs 94% higher than the state average, at 33.1%. That marks Mississippi as a major freight corridor, where highway access is what logistics operators compete on.
Mississippi also posts the highest highway truck share in Arkansas - 33.1%. 76% of counties in Arkansas see fewer highway trucks per day than Mississippi's roughly 2,170.
| Traffic | vehicles per day3,123 |
|---|---|
| Trucks | 9.5% |
| Average travel time | 31.5 min |
| Congestion ratio | 9.7% |
| Drivers’ average age | 45.3 yrs |
| Drivers’ average income | $64,422 |
A little more than half of the driving in Mississippi County, Arkansas happens on local roads: 57% of all vehicle-miles. On the average non-highway road, that comes to 3,123 vehicles per day.
Local roads make up 82% of the monitored road miles (441 miles in 4,254 segments) but carry less than their share of travel: 978,186 vehicle-miles traveled per day (≈357 million per year). Trucks make up 9.5% of non-highway traffic, about 1 in 10 vehicles.
Non-highway roads carry a truck concentration that's 71% lower than the highway network.
Non-highway congestion (9.7%) runs 22% lower than the state average, pointing to smoother local traffic flow.
85% of counties in Arkansas see lower average driver income among trip origins than Mississippi. Mississippi's median driver age is lower than 84% of counties in Arkansas.
Mississippi County's biggest difference from the Arkansas average is its highway truck share, 94% above it. Its truck share is also 70% above.
| Metric | Mississippi County | Arkansas average | Difference |
|---|---|---|---|
| Traffic | 3,212 | 4,932 | -34.9% |
| Truck % (Total Traffic) | 19.8% | 11.6% | +70.2% |
| Truck % (Highway) | 33.1% | 17.1% | +93.7% |
| Avg. Travel Time | 32.1 min | 31.6 min | +1.3% |
Set against the average of the 4 areas nearest to it, Mississippi County runs 10.3 percentage points more truck traffic; it has the third busiest roads of the five. Freight passes through here that never reaches the areas around it: the truck share is high precisely because the local car traffic is not.
| Area | Average daily traffic | Truck share | Daily vehicle-miles | Average travel time | Congestion ratio |
|---|---|---|---|---|---|
| Mississippi County | 3,212 | 19.8% | 1,725,314 | 32.1 min | 9.8% |
| Lauderdale County, Tennessee | 2,983 | 9.3% | 446,167 | 31.5 min | 7.6% |
| Tipton County, Tennessee | 3,492 | 6.6% | 939,516 | 28.1 min | 9.4% |
| Craighead County, Arkansas | 7,766 | 8.0% | 2,822,505 | 32.3 min | 15.1% |
| Poinsett County, Arkansas | 2,320 | 13.9% | 840,105 | 35.1 min | 7.7% |
| Arkansas average | 4,932 | 11.6% | N/A | 31.6 min | 12.8% |
Mississippi County posts the highest truck share on highways of any county-level area in Arkansas.
| Measure | Mississippi County | Arkansas rank |
|---|---|---|
| Traffic volume (AADT) | 3,212 | #24 of 75 |
| Highway vehicle-miles per day | 747,128 | #23 of 64 |
| Truck share on highways | 33.1% | #1 of 64 |
| Highway trucks per day | 2,170 | #16 of 64 |
| Average travel time | 32.1 min | #47 of 75 |
| Average driver income | $63,773 | #12 of 75 |
| Average driver age | 45.3 yrs | #63 of 75 |
Mississippi County ranks #1 of 64 on truck share on highways but #63 of 75 on average driver age - the two describe the same roads and are worth reading together rather than either on its own.
Traffic concentrates on a few corridors: the three busiest roads average 17,702 vehicles a day, against 3,212 on the average road in Mississippi County.
AR 18 is the busiest road, at 21,230 vehicles a day, 1,839 of them trucks (8.7%). I 55 carries the most trucks, 5,113 a day (33.1% of its traffic), although it ranks #3 for all traffic.
I 55 carries longer journeys than most roads here, with a median trip of 51.7 minutes against 32.1 county-wide.
Drivers on East Main come from neighborhoods with an average household income of $89,620, 41% above the county average of $63,773.
Freight stands out on I 55: trucks are 33.1% of the traffic there, against 19.8% county-wide.
Delays build on AR 18: its congestion ratio of 66% over free-flow time is well above the county's 10%.
Travel on Main Street's busiest stretch runs 51% over free-flow time, against 10% across the county, so expect slower peak hours.
I 55 carries 4.8 times the county average on its busiest stretch, where the median trip lasts 51.7 minutes.
At 3.8 times the county average, East Main draws drivers from neighborhoods averaging $89,620 in household income.
The busiest stretch of Ash Street carries 3.6 times the county average; trucks are 7.7% of it, below the county-wide 19.8%.
On its busiest stretch, Armorel Drive carries 2.5 times the county average; trucks are 13.8% of it, below the county-wide 19.8%.
The average monitored road in Mississippi carries 3,212 vehicles per day, 35% less than the Arkansas average of 4,932.
Yes - Mississippi has the highest highway truck share of any county in Arkansas, at 33.1%.
Weekday traffic has two busy windows: AM peak 7:00 AM–8:00 AM and PM peak 4:00 PM–7:00 PM - about 65% above the daily average.
Drivers on Mississippi roads have a median age of 45 years, and the median household income of the neighborhoods trips originate from averages $63,773, in line with the Arkansas average.
Approximately 28% of highway traffic and 8% of non-highway traffic consists of vehicles whose trip originates outside Mississippi County, Arkansas. Even highway traffic is mostly local, so these roads mainly serve residents and commuters.
Trucks make up about 19.8% of all traffic in Mississippi County, Arkansas, rising to 33.1% on highways, where long-haul freight concentrates.
AR 18 carries the most, 21,230 vehicles per day on its busiest stretch, followed by Main Street (16,443), I 55 (15,433), East Main (12,129), Ash Street (11,590). Figures are AADT, both directions combined.
I 55, with about 5,113 trucks per day on its busiest stretch, 33.1% of its 15,433 vehicles.
About 21,230 vehicles per day in both directions on its busiest stretch, including 1,839 trucks (8.7%). Traffic is lower on its quieter stretches; TrafficZoom shows the count for every segment.

Mobile device location data (anonymized and aggregated)

Road sensor networks and traffic counters

Historical traffic pattern databases
The same traffic breakdown for the areas closest to Mississippi County, Arkansas.
Identify traffic patterns street by street and analyze the exact corridors that matter to your project.
