
Need segment-level traffic data?
Identify traffic patterns street by street and analyze the exact corridors that matter to your project.
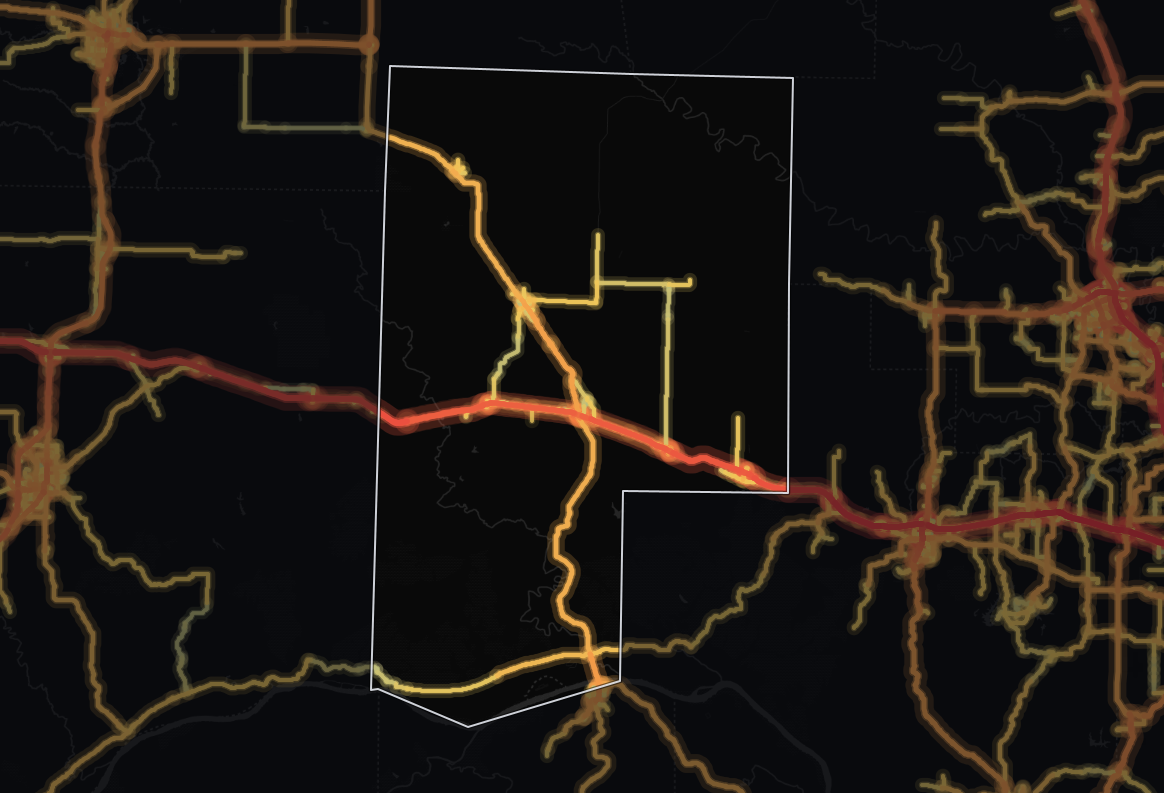
TrafficThe average number of vehicles that travel each day over any road in the road network. | vehicles per day1,321 |
|---|---|
TrucksThe percentage of the total traffic volume composed of heavy vehicles. | 20.6% |
Average travel timeThe average time of travel averaged among all vehicles traveling on the road network. | 42.2 min |
Drivers’ average ageAverage age of residents in the geographic areas where the vehicle trips originated. | 45.9 yrs |
Drivers’ average incomeAverage income of residents in the geographic areas where the vehicle trips originated. | $71,986 |
Our data shows 1,321 vehicles per day on the average road in Montgomery County, Missouri, and 854,353 vehicle-miles traveled per day (≈312 million per year) across its 225 miles of monitored roads. About 1 in 5 vehicles is a truck, well above the 9.8% across Missouri - a freight-heavy mix.
Montgomery sees 77% lower average daily traffic volume than the state average (1,321 vehicles per day against 5,631), suggesting less demand on each road - quiet roads that suit freight movement more than drive-by retail. In total volume terms, its road network carries about 0.5% of Missouri's statewide total of vehicle-miles. By volume, Montgomery's 1,321 vehicles per day trails 86% of counties in Missouri.
Journey times run 35% higher than the state level, at 42.2 minutes on average. 98% of counties in Missouri have a shorter average travel time than Montgomery's 42.2 minutes.
| Traffic | vehicles per day13,036 |
|---|---|
| Trucks | 23.6% |
| Average travel time | 63.0 min |
| Drivers’ average age | 44.9 yrs |
| Drivers’ average income | $76,603 |
Most travel in Montgomery County, Missouri happens on highways, 79% of all vehicle-miles. The average highway carries 13,036 vehicles per day, 1137% more than the average non-highway road in the same area, which carries 1,054 vehicles per day.
That comes from just 22% of the monitored road miles: 49 miles in 45 segments, carrying 679,049 vehicle-miles traveled per day (≈248 million per year).
67% of counties in Missouri move less traffic on their highways.
The concentration of trucks on highways (23.6%) is 76% higher than the state average for similar road classifications. That marks Montgomery as a major freight corridor, where highway access is what logistics operators compete on.
87% of counties in Missouri see a lower highway truck share than Montgomery's 23.6%. By raw truck volume, Montgomery carries more highway trucks than 92% of counties in Missouri.
| Traffic | vehicles per day1,054 |
|---|---|
| Trucks | 9.1% |
| Average travel time | 41.7 min |
| Drivers’ average age | 51.5 yrs |
| Drivers’ average income | $64,381 |
At 21% of vehicle-miles, local roads carry a smaller share of the traffic in Montgomery County, Missouri than highways. A typical local road sees 1,054 vehicles per day.
Spread over 176 miles and 1,977 segments, 78% of the road network, local roads carry a lighter load per mile: 175,304 vehicle-miles traveled per day (≈64.0 million per year). Trucks make up 9.1% of non-highway traffic, about 1 in 11 vehicles.
The concentration of trucks on non-highway roads is 61% lower than on highways.
82% of counties in Missouri see lower average driver income among trip origins than Montgomery. The driver population here skews younger than 87% of counties in Missouri.
The truck share sets Montgomery County apart: 110% above the Missouri average. Its average daily traffic per road, by contrast, is 77% below.
| Metric | Montgomery County | Missouri average | Difference |
|---|---|---|---|
| Traffic | 1,321 | 5,631 | -76.5% |
| Truck % (Total Traffic) | 20.6% | 9.8% | +110.2% |
| Truck % (Highway) | 23.6% | 13.4% | +75.5% |
| Avg. Travel Time | 42.2 min | 31.3 min | +34.8% |
Against the 4 nearest areas, Montgomery County carries 58.2% less traffic on a typical road and runs 9.4 percentage points more truck traffic; it has the quietest roads of the five. Freight passes through here that never reaches the areas around it: the truck share is high precisely because the local car traffic is not.
| Area | Average daily traffic | Truck share | Daily vehicle-miles | Average travel time | Congestion ratio |
|---|---|---|---|---|---|
| Montgomery County | 1,321 | 20.6% | 854,353 | 42.2 min | N/A |
| Warren County, Missouri | 3,656 | 13.8% | 1,516,294 | 30.0 min | 14.9% |
| Callaway County, Missouri | 1,825 | 14.5% | 2,086,385 | 31.0 min | 7.6% |
| Audrain County, Missouri | 2,092 | 8.9% | 456,318 | 36.1 min | 5.7% |
| Lincoln County, Missouri | 5,065 | 7.9% | 1,926,249 | 28.6 min | 9.1% |
| Missouri average | 5,631 | 9.8% | N/A | 31.3 min | 19.4% |
Montgomery County sits in Missouri's top three on average travel time.
| Measure | Montgomery County | Missouri rank |
|---|---|---|
| Traffic volume (AADT) | 1,321 | #99 of 115 |
| Highway vehicle-miles per day | 679,049 | #31 of 93 |
| Truck share on highways | 23.6% | #13 of 93 |
| Highway trucks per day | 3,078 | #8 of 93 |
| Average travel time | 42.2 min | #3 of 115 |
| Average driver income | $71,986 | #21 of 115 |
| Average driver age | 45.9 yrs | #100 of 115 |
Montgomery County ranks #3 of 115 on average travel time but #100 of 115 on average driver age - the two describe the same roads and are worth reading together rather than either on its own.
The three busiest roads in Montgomery County average 12,429 vehicles a day, 9.4 times the county average of 1,321 across all its monitored roads.
I 70 leads with 27,546 vehicles a day, 6,503 of them trucks (23.6%). That is 5.1 times the next road, Market Street (5,444). It tops the truck ranking too, with the most trucks.
I 70 carries longer journeys than most roads here, with a median trip of 63.0 minutes against 42.2 county-wide.
Sturgeon Street is busy with cars rather than freight: only 9.4% of its traffic is trucks, against 20.6% county-wide.
I 70 carries 20.9 times the county average on its busiest stretch, where the median trip lasts 63.0 minutes.
Market Street carries 4.1 times the county average on its busiest stretch, where the median trip lasts 40.5 minutes.
At 3.3 times the county average, Sturgeon Street draws drivers from neighborhoods averaging $61,778 in household income.
Outer Road carries through traffic: the median trip using it lasts 61.5 minutes, against 42.2 for the county.
The busiest stretch of 1st Street carries 2.6 times the county average; trucks are 7.3% of it, below the county-wide 20.6%.
Hudson Street carries 83% more than the county average on its busiest stretch, where the median trip lasts 35.1 minutes.
On its busiest stretch, MO 19 carries 2.3 times the county average; trucks are 10.0% of it, below the county-wide 20.6%.
The average monitored road in Montgomery carries 1,321 vehicles per day, 77% less than the Missouri average of 5,631.
Montgomery carries more highway trucks by raw volume than 92% of counties in Missouri, at roughly 3,078 per day.
Approximately 76% of highway traffic and 18% of non-highway traffic consists of vehicles whose trip originates outside Montgomery County, Missouri. Most highway traffic here starts elsewhere, so the highways serve the wider region more than the local community.
Weekday traffic has two busy windows: AM peak 10:00 AM–12:00 PM and a long afternoon plateau from 3:00 PM to 7:00 PM - about 71% above the daily average.
Trucks make up about 20.6% of all traffic in Montgomery County, Missouri, rising to 23.6% on highways, where long-haul freight concentrates.
I 70 carries the most, 27,546 vehicles per day on its busiest stretch, followed by Market Street (5,444), Sturgeon Street (4,298), Outer Road (3,607), 1st Street (3,382). Figures are AADT, both directions combined.
I 70, with about 6,503 trucks per day on its busiest stretch, 23.6% of its 27,546 vehicles.
About 27,546 vehicles per day in both directions on its busiest stretch, including 6,503 trucks (23.6%). Traffic is lower on its quieter stretches; TrafficZoom shows the count for every segment.

Mobile device location data (anonymized and aggregated)

Road sensor networks and traffic counters

Historical traffic pattern databases
The same traffic breakdown for the areas closest to Montgomery County, Missouri.
Identify traffic patterns street by street and analyze the exact corridors that matter to your project.
