
Need segment-level traffic data?
Identify traffic patterns street by street and analyze the exact corridors that matter to your project.
Traffic | vehicles per day6,525 |
|---|---|
Trucks | 6.2% |
Average travel time | 33.1 min |
Congestion ratio | 17.1% |
Drivers’ average age | 43.2 yrs |
Drivers’ average income | $96,108 |
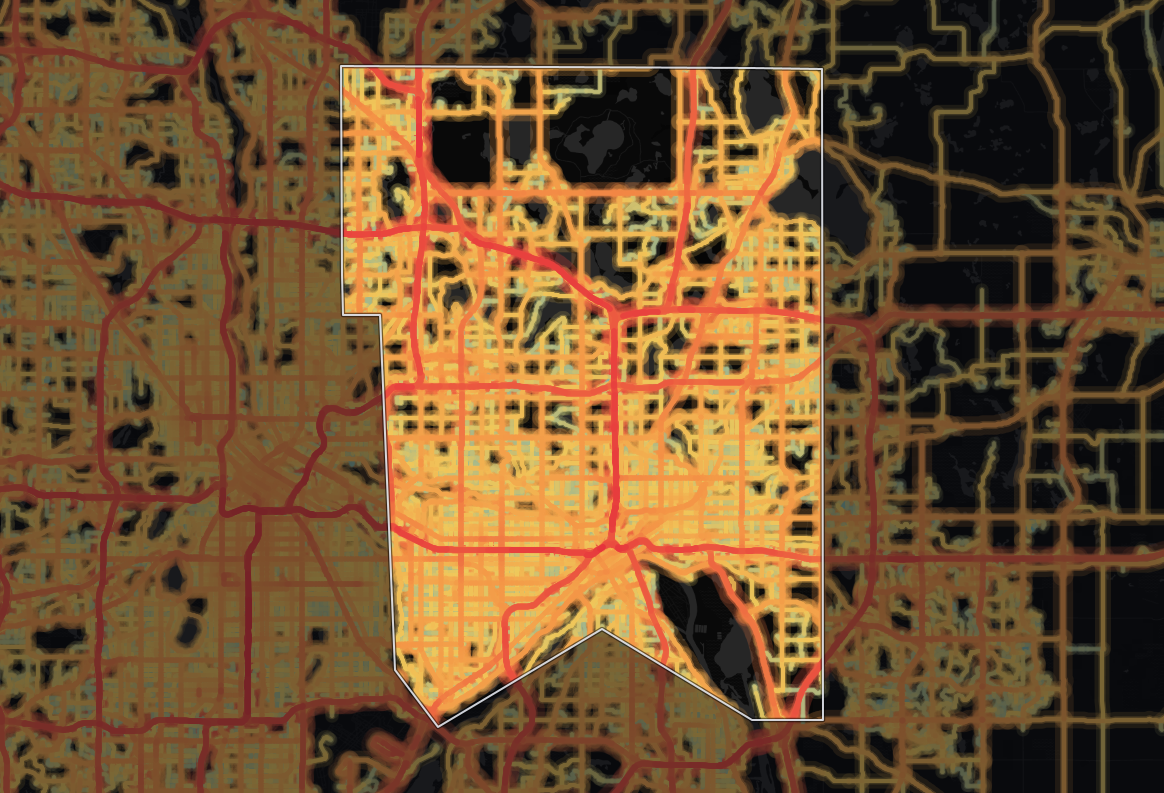
A typical monitored road in Ramsey County, Minnesota sees 6,525 vehicles per day, while its 922 miles of monitored roads together handle 10,659,237 vehicle-miles traveled per day (≈3.9 billion per year). Trucks are a smaller part of the mix than across Minnesota: 6.2% against 8.1%.
Ramsey's average daily traffic volume is 92% higher than the state average - 6,525 vehicles per day against 3,404 - suggesting more traffic load per road - heavy exposure for roadside retail, and tight road space for deliveries. Network-wide, Ramsey accounts for about 7.6% of Minnesota's statewide total of vehicle-miles. Ramsey stands out as having the highest traffic volume in Minnesota - 6,525 vehicles per day.
At 33.1 minutes, the average travel time matches the state level closely. 51% of counties in Minnesota have a longer average travel time than Ramsey's 33.1 minutes.
At 62% higher than the state level, the 17.1% congestion ratio signals more pronounced congestion - peak-hour routing and delivery windows need real slack here.
| Traffic | vehicles per day34,004 |
|---|---|
| Trucks | 7.6% |
| Average travel time | 34.0 min |
| Congestion ratio | 53.4% |
| Drivers’ average age | 43.5 yrs |
| Drivers’ average income | $99,052 |
Highways carry more than half of all travel in Ramsey County, Minnesota (63% of vehicle-miles). The average highway carries 34,004 vehicles per day, 512% more than the average non-highway road in the same area, which carries 5,554 vehicles per day.
That comes from just 21% of the monitored road miles: 190 miles in 949 segments, carrying 6,668,408 vehicle-miles traveled per day (≈2.4 billion per year).
By highway travel volume, that ranks Ramsey in the top 3 counties in Minnesota.
Highway truck concentration here runs 26% lower than the state average, at 7.6%. Trucks are a small share of a very large highway flow, so Ramsey still moves heavy freight volumes alongside its passenger traffic.
Ramsey's highway truck share (7.6%) is lower than 98% of counties in Minnesota. Ramsey's highway truck count is higher than 99% of counties in Minnesota, at roughly 2,581 trucks per day.
| Traffic | vehicles per day5,554 |
|---|---|
| Trucks | 3.9% |
| Average travel time | 33.1 min |
| Congestion ratio | 15.8% |
| Drivers’ average age | 42.3 yrs |
| Drivers’ average income | $92,126 |
A significant share of driving in Ramsey County, Minnesota, 37% of vehicle-miles, happens on local roads. A typical local road sees 5,554 vehicles per day.
Local roads make up 79% of the monitored road miles (731 miles in 26,845 segments) but carry less than their share of travel: 3,990,829 vehicle-miles traveled per day (≈1.5 billion per year). About 1 in 26 vehicles on non-highway roads is a truck (3.9%).
Non-highway roads carry a truck concentration that's 49% lower than the highway network.
At 63% higher than the state level, the non-highway congestion ratio of 15.8% signals more friction on local roads.
Ramsey's average driver income is higher than 87% of counties in Minnesota. Ramsey's median driver age is lower than 95% of counties in Minnesota.


Mobile device location data (anonymized and aggregated)
Road sensor networks and traffic counters
Historical traffic pattern databases

Identify traffic patterns street by street and analyze the exact corridors that matter to your project.



