
Need segment-level traffic data?
Identify traffic patterns street by street and analyze the exact corridors that matter to your project.
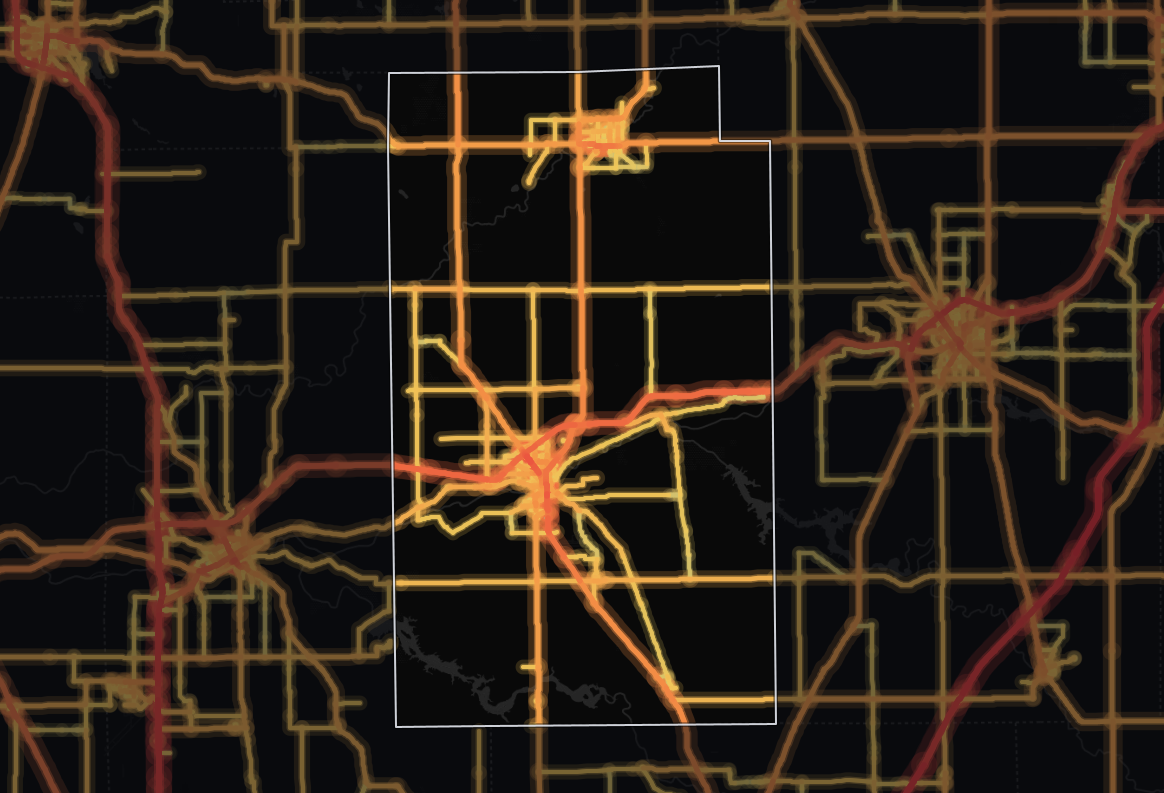
Traffic | vehicles per day3,319 |
|---|---|
Trucks | 10.2% |
Average travel time | 33.2 min |
Congestion ratio | 11.6% |
Drivers’ average age | 49.6 yrs |
Drivers’ average income | $72,913 |
The average monitored road in Wabash County, Indiana carries 3,319 vehicles per day. Across its 213 miles of monitored roads, that adds up to 625,505 vehicle-miles traveled per day (≈228 million per year). About 1 in 10 vehicles is a truck, fewer than the 1 in 8 across Indiana.
At 3,319 vehicles per day, the average monitored road in Wabash carries 42% less traffic than the state average of 5,704, suggesting less demand on each road - lighter roads for freight, but less passing trade for roadside retail. Across the whole network, that travel is about 0.4% of Indiana's statewide total. 62% of counties in Indiana see more traffic than Wabash's 3,319 vehicles per day.
Journey times here (33.2 minutes on average) closely track the state level. On travel time, Wabash runs shorter than 66% of counties in Indiana.
At 26% lower than the state level, the 11.6% congestion ratio signals smoother traffic flow - travel times are easy to plan around for scheduled deliveries.
| Traffic | vehicles per day4,958 |
|---|---|
| Trucks | 14.2% |
| Average travel time | 46.5 min |
| Congestion ratio | 11.7% |
| Drivers’ average age | 49.0 yrs |
| Drivers’ average income | $72,340 |
At 30% of vehicle-miles, highways carry a smaller share of the traffic in Wabash County, Indiana than local roads. The average highway carries 4,958 vehicles per day, 51% more than the average non-highway road in the same area, which carries 3,288 vehicles per day.
With 17% of the road miles (36 miles in 69 segments), highways punch above their length, carrying 184,538 vehicle-miles traveled per day (≈67.4 million per year).
At 14.2%, highway truck share is 28% lower than the state average. Highways here mostly serve passenger trips, so local access matters more than long-haul routing for logistics operators.
82% of counties in Indiana see a higher highway truck share than Wabash's 14.2%. Wabash's highway truck count is lower than 87% of counties in Indiana, at roughly 703 trucks per day.
| Traffic | vehicles per day3,288 |
|---|---|
| Trucks | 8.5% |
| Average travel time | 33.0 min |
| Congestion ratio | 11.6% |
| Drivers’ average age | 49.6 yrs |
| Drivers’ average income | $73,073 |
Local roads carry most of the traffic in Wabash County, Indiana: 70% of all vehicle-miles. A typical local road sees 3,288 vehicles per day.
Their share of road miles is similar, 83% (177 miles in 3,591 segments), carrying 440,967 vehicle-miles traveled per day (≈161 million per year). The truck share on non-highway roads is 8.5%.
Compared to highways, non-highway routes see 40% fewer trucks by share.
At 24% lower than the state level, the non-highway congestion ratio of 11.6% signals easier movement on local roads.
Trip origins here have lower average income than 53% of counties in Indiana. The driver population here skews older than 84% of counties in Indiana.

Mobile device location data (anonymized and aggregated)
Road sensor networks and traffic counters
Historical traffic pattern databases

Identify traffic patterns street by street and analyze the exact corridors that matter to your project.



