
Need segment-level traffic data?
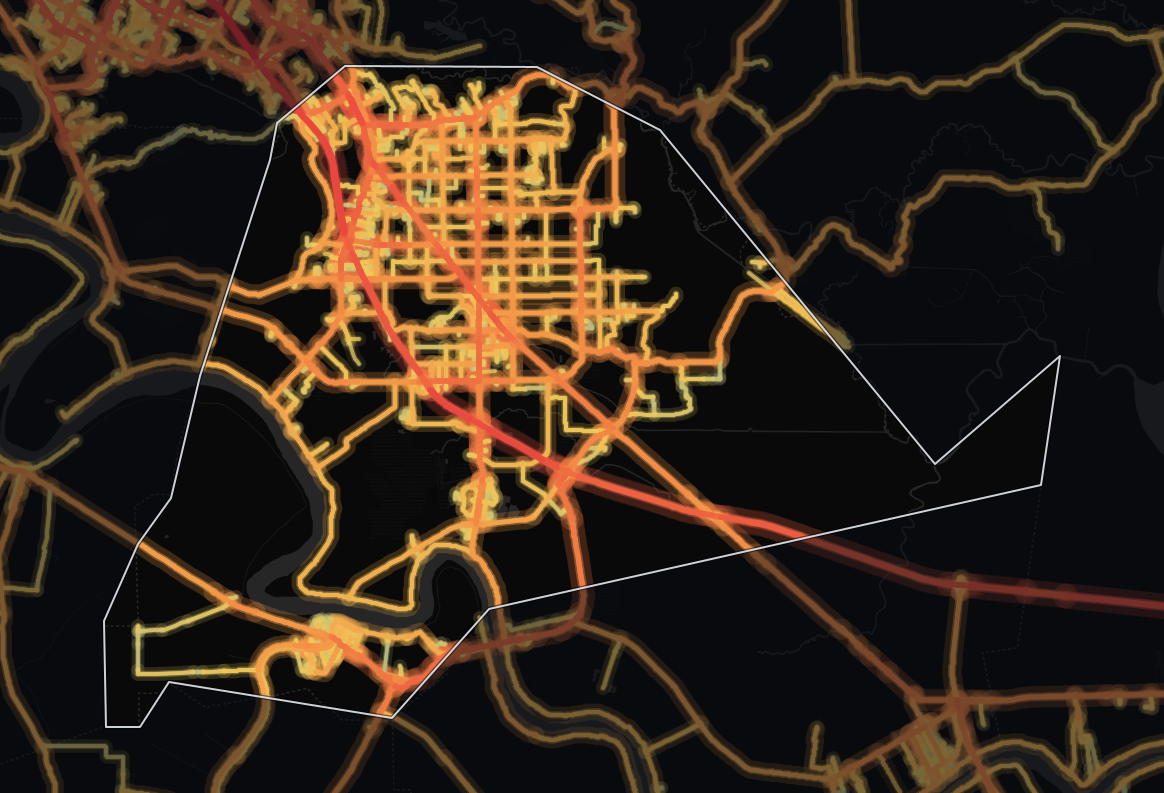
Identify traffic patterns street by street and analyze the exact corridors that matter to your project.
Traffic | vehicles per day7,402 |
|---|---|
Trucks | 10.8% |
Average travel time | 30.6 min |
Congestion ratio | 20.0% |
Drivers’ average age | 43.2 yrs |
Drivers’ average income | $96,079 |
The average monitored road in Ascension Parish, Louisiana carries 7,402 vehicles per day. Across its 346 miles of monitored roads, that adds up to 2,826,414 vehicle-miles traveled per day (≈1.0 billion per year). Trucks are 10.8% of traffic, close to the 11.2% across Louisiana.
At 7,402 vehicles per day, the average monitored road in Ascension carries 22% more traffic than the state average of 6,061, suggesting more demand on each road - a factor worth weighing in site selection and logistics planning. Across the whole network, that travel is about 2.3% of Louisiana's statewide total. Ascension carries more traffic than 87% of counties in Louisiana.
The average trip takes 30.6 minutes, on par with the state level. On travel time, Ascension runs shorter than 79% of counties in Louisiana.
Congestion runs 16% higher than the state level, at a ratio of 20.0%, which means more pronounced congestion - crucial for traffic control improvement and logistics planning.
| Traffic | vehicles per day11,588 |
|---|---|
| Trucks | 14.5% |
| Average travel time | 34.2 min |
| Congestion ratio | 25.3% |
| Drivers’ average age | 42.9 yrs |
| Drivers’ average income | $93,744 |
Travel in Ascension Parish, Louisiana splits roughly evenly, with about half of it (51% of vehicle-miles) on highways. The average highway carries 11,588 vehicles per day, 65% more than the average non-highway road in the same area, which carries 7,012 vehicles per day.
Highways make up 32% of the monitored road miles (109 miles, 855 segments), so they carry more than their share: 1,451,849 vehicle-miles traveled per day (≈530 million per year).
By highway travel volume, Ascension outranks 73% of counties in Louisiana.
At 14.5%, highway truck share is 10% lower than the state average. The highway traffic mix is typical for Louisiana: neither freight- nor commuter-dominated.
Ascension's highway truck share (14.5%) is lower than 55% of counties in Louisiana. Ascension's highway truck count is higher than 57% of counties in Louisiana, at roughly 1,679 trucks per day.
| Traffic | vehicles per day7,012 |
|---|---|
| Trucks | 6.9% |
| Average travel time | 30.3 min |
| Congestion ratio | 19.5% |
| Drivers’ average age | 43.3 yrs |
| Drivers’ average income | $97,724 |
Travel in Ascension Parish, Louisiana splits roughly evenly, with about half of it (49% of vehicle-miles) on local roads. The average non-highway road carries 7,012 vehicles per day.
Local roads make up 68% of the monitored road miles (236 miles in 9,178 segments) but carry less than their share of travel: 1,374,565 vehicle-miles traveled per day (≈502 million per year). The truck share on non-highway roads is 6.9%.
Non-highway roads carry a truck concentration that's 52% lower than the highway network.
At 16% higher than the state level, the non-highway congestion ratio of 19.5% signals more friction on local roads.
Trips here originate from the highest average driver income in Louisiana, at $96,079. 87% of counties in Louisiana have an older driver population than Ascension.


Mobile device location data (anonymized and aggregated)
Road sensor networks and traffic counters
Historical traffic pattern databases

Identify traffic patterns street by street and analyze the exact corridors that matter to your project.



