
Need segment-level traffic data?
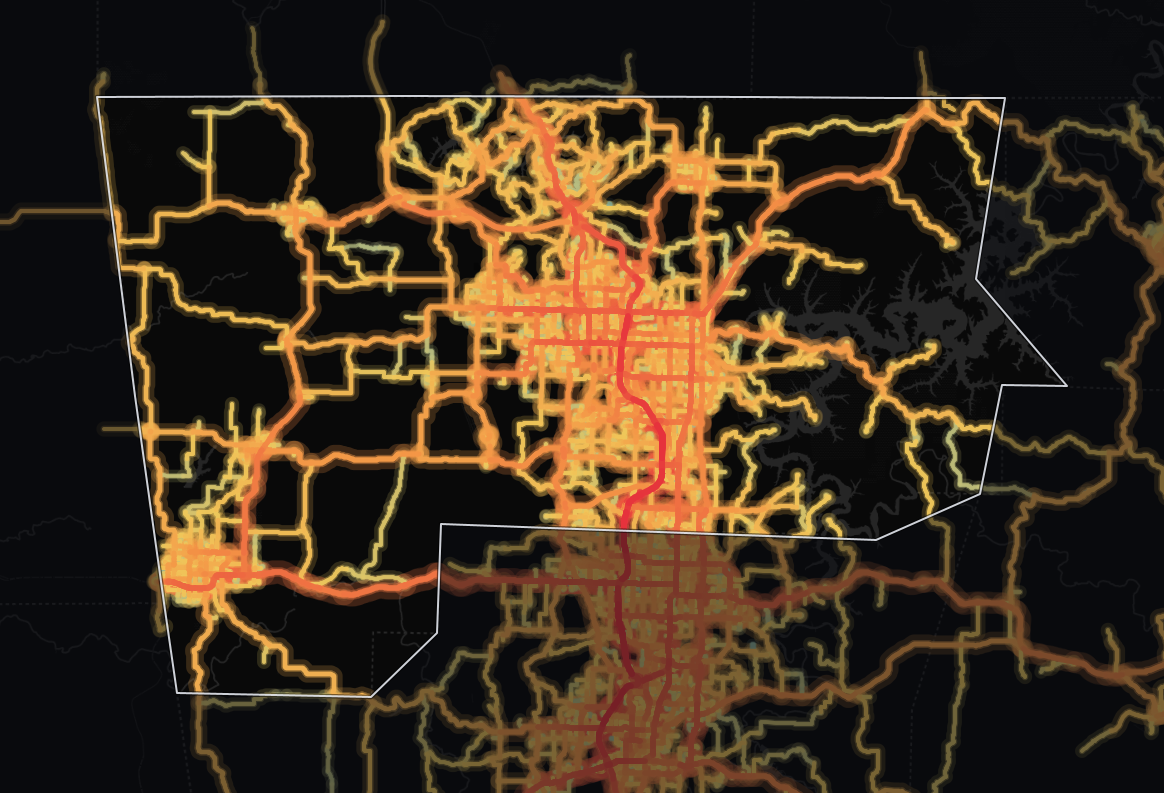
Identify traffic patterns street by street and analyze the exact corridors that matter to your project.
Traffic | vehicles per day7,831 |
|---|---|
Trucks | 6.4% |
Average travel time | 33.5 min |
Congestion ratio | 18.1% |
Drivers’ average age | 41.7 yrs |
Drivers’ average income | $97,876 |
The average monitored road in Benton County, Arkansas carries 7,831 vehicles per day. Across its 851 miles of monitored roads, that adds up to 6,428,259 vehicle-miles traveled per day (≈2.3 billion per year). Traffic here is mostly passenger cars: only 6.4% trucks, against 11.6% across Arkansas.
Benton's average daily traffic volume is 59% higher than the state average - 7,831 vehicles per day against 4,932 - suggesting more traffic load per road - prime passing trade for storefronts, with more competition for road space. In total volume terms, its road network carries about 7.3% of Arkansas's statewide total of vehicle-miles. 97% of counties in Arkansas see less traffic than Benton's 7,831 vehicles per day.
The average trip takes 33.5 minutes, 6% higher than the state level. Its average travel time of 33.5 minutes is longer than 62% of counties in Arkansas.
Congestion runs 42% higher than the state level, at a ratio of 18.1%, which means more pronounced congestion - a factor for delivery windows and signal timing.
| Traffic | vehicles per day18,396 |
|---|---|
| Trucks | 9.9% |
| Average travel time | 37.7 min |
| Congestion ratio | 32.6% |
| Drivers’ average age | 41.8 yrs |
| Drivers’ average income | $92,156 |
Highways carry a smaller share of travel in Benton County, Arkansas, 27% of vehicle-miles; most driving happens on local roads. The average highway carries 18,396 vehicles per day, 144% more than the average non-highway road in the same area, which carries 7,554 vehicles per day.
With 12% of the road miles (103 miles in 445 segments), highways punch above their length, carrying 1,764,324 vehicle-miles traveled per day (≈644 million per year).
That puts Benton among the top 5 counties in Arkansas for highway travel volume.
At 9.9%, highway truck share is 42% lower than the state average. Highways here carry mainly commuter and local trips, with little through freight.
Benton's highway truck share (9.9%) is lower than 95% of counties in Arkansas. 70% of counties in Arkansas see fewer highway trucks per day than Benton's roughly 1,814.
| Traffic | vehicles per day7,554 |
|---|---|
| Trucks | 5.2% |
| Average travel time | 33.4 min |
| Congestion ratio | 17.7% |
| Drivers’ average age | 41.7 yrs |
| Drivers’ average income | $99,821 |
Local roads carry most of the traffic in Benton County, Arkansas: 73% of all vehicle-miles. The average non-highway road carries 7,554 vehicles per day.
Their share of road miles is similar, 88% (747 miles in 16,985 segments), carrying 4,663,935 vehicle-miles traveled per day (≈1.7 billion per year). The truck share on non-highway roads is 5.2%.
Compared to highways, non-highway routes see 48% fewer trucks by share.
Non-highway congestion (17.7%) runs 43% higher than the state average, pointing to slower local traffic flow.
At $97,876, the average driver income for trips originating here is the highest in Arkansas. The driver population here skews younger than 99% of counties in Arkansas.

Mobile device location data (anonymized and aggregated)
Road sensor networks and traffic counters
Historical traffic pattern databases

Identify traffic patterns street by street and analyze the exact corridors that matter to your project.



