
Need segment-level traffic data?
Identify traffic patterns street by street and analyze the exact corridors that matter to your project.
Traffic | vehicles per day2,137 |
|---|---|
Trucks | 19.9% |
Average travel time | 32.0 min |
Congestion ratio | 7.3% |
Drivers’ average age | 49.6 yrs |
Drivers’ average income | $64,345 |
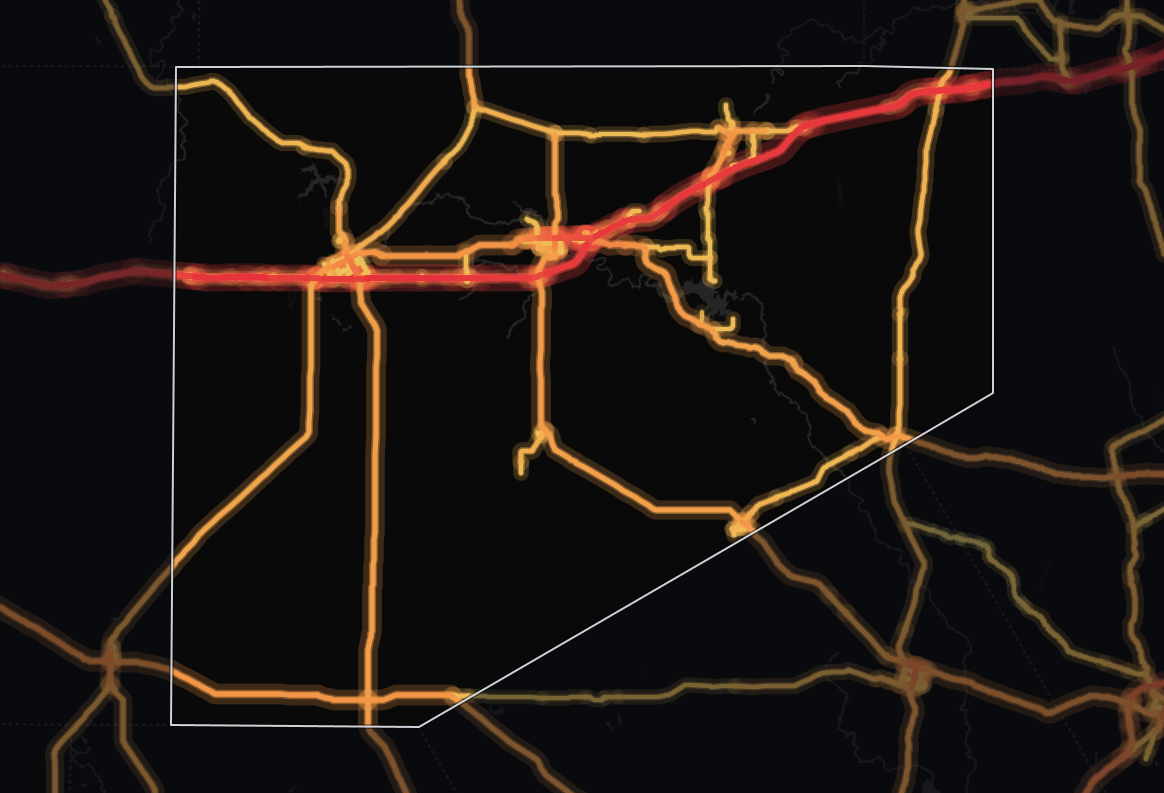
The average monitored road in Eastland County, Texas carries 2,137 vehicles per day. Across its 463 miles of monitored roads, that adds up to 1,373,896 vehicle-miles traveled per day (≈501 million per year). Freight weighs heavily here: trucks are 19.9% of traffic, against 9.8% across Texas.
Eastland sees 69% lower average daily traffic volume than the state average (2,137 vehicles per day against 6,895), suggesting less demand on each road - quiet roads that suit freight movement more than drive-by retail. Across the whole network, that travel is about 0.2% of Texas's statewide total. 70% of counties in Texas see more traffic than Eastland's 2,137 vehicles per day.
At 32.0 minutes, the average travel time matches the state level closely. 77% of counties in Texas have a longer average travel time than Eastland's 32.0 minutes.
At 55% lower than the state level, the 7.3% congestion ratio signals smoother traffic flow - delays are rare enough to plan travel times almost to the minute.
| Traffic | vehicles per day10,642 |
|---|---|
| Trucks | 25.8% |
| Average travel time | 64.5 min |
| Congestion ratio | 24.2% |
| Drivers’ average age | 48.2 yrs |
| Drivers’ average income | $69,142 |
Highways carry more than half of all travel in Eastland County, Texas (66% of vehicle-miles). The average highway carries 10,642 vehicles per day, 505% more than the average non-highway road in the same area, which carries 1,760 vehicles per day.
Yet highways are only 17% of the road network, 80 miles in 129 segments, so each mile of them is 3.8 times as busy as the average road mile.
By highway travel volume, Eastland outranks 66% of counties in Texas.
At 25.8%, highway truck share is 88% higher than the state average. That marks Eastland as a major freight corridor, where highway access is what logistics operators compete on.
87% of counties in Texas see a lower highway truck share than Eastland's 25.8%. By raw truck volume, Eastland carries more highway trucks than 85% of counties in Texas.
| Traffic | vehicles per day1,760 |
|---|---|
| Trucks | 8.6% |
| Average travel time | 30.5 min |
| Congestion ratio | 6.6% |
| Drivers’ average age | 51.6 yrs |
| Drivers’ average income | $61,692 |
Local roads carry a significant share of travel in Eastland County, Texas: 34% of all vehicle-miles. The average non-highway road carries 1,760 vehicles per day.
Local roads make up 83% of the monitored road miles (383 miles in 2,905 segments) but carry less than their share of travel: 473,271 vehicle-miles traveled per day (≈173 million per year). About 1 in 12 vehicles on non-highway roads is a truck (8.6%).
Compared to highways, non-highway routes see 66% fewer trucks by share.
Non-highway congestion (6.6%) runs 59% lower than the state average, pointing to smoother local traffic flow.
69% of counties in Texas see higher average driver income among trip origins than Eastland. Eastland's median driver age is higher than 81% of counties in Texas.

Mobile device location data (anonymized and aggregated)
Road sensor networks and traffic counters
Historical traffic pattern databases

Identify traffic patterns street by street and analyze the exact corridors that matter to your project.



