
Need segment-level traffic data?
Identify traffic patterns street by street and analyze the exact corridors that matter to your project.
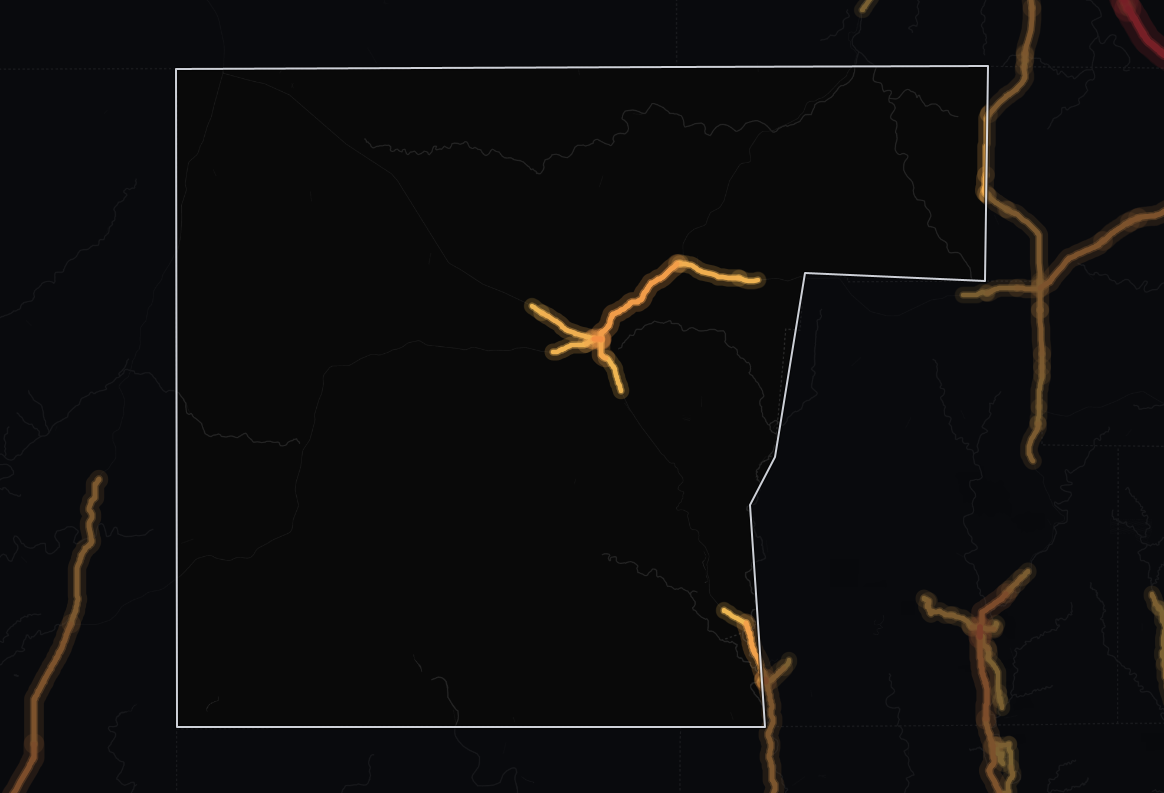
TrafficThe average number of vehicles that travel each day over any road in the road network. | vehicles per day568 |
|---|---|
TrucksThe percentage of the total traffic volume composed of heavy vehicles. | 15.3% |
Average travel timeThe average time of travel averaged among all vehicles traveling on the road network. | 36.1 min |
Congestion ratioThe rate at which the actual travel time exceeds free-flow travel time, averaged among all roads in the network. | 3.1% |
Drivers’ average ageAverage age of residents in the geographic areas where the vehicle trips originated. | 50.1 yrs |
Drivers’ average incomeAverage income of residents in the geographic areas where the vehicle trips originated. | $41,120 |
The average monitored road in Edwards County, Texas carries 568 vehicles per day. Across its 157 miles of monitored roads, that adds up to 64,565 vehicle-miles traveled per day (≈23.6 million per year). Freight weighs heavily here: trucks are 15.3% of traffic, against 9.8% across Texas.
Edwards sees 92% lower average daily traffic volume than the state average (568 vehicles per day against 6,895), suggesting less demand on each road - quiet roads that suit freight movement more than drive-by retail. In total volume terms, its road network carries less than 0.1% of Texas's statewide total of vehicle-miles. By volume, Edwards's 568 vehicles per day trails 99% of counties in Texas.
The average trip takes 36.1 minutes, 11% higher than the state level. 60% of counties in Texas have a shorter average travel time than Edwards's 36.1 minutes.
At 81% lower than the state level, the 3.1% congestion ratio signals smoother traffic flow - free-flowing roads make scheduled deliveries highly predictable.
| Traffic | vehicles per day654 |
|---|---|
| Trucks | 18.5% |
| Average travel time | 31.0 min |
| Congestion ratio | 3.4% |
| Drivers’ average age | 52.0 yrs |
| Drivers’ average income | $43,100 |
Highways carry a significant share of travel in Edwards County, Texas: 40% of all vehicle-miles. The average highway carries 654 vehicles per day, 32% more than the average non-highway road in the same area, which carries 497 vehicles per day.
Highways also make up about 44% of the monitored road miles: 69 miles in 281 segments, together carrying 26,114 vehicle-miles traveled per day (≈9.5 million per year).
At 18.5%, highway truck share is 35% higher than the state average. Highways here lean toward freight, so highway access is a real asset for logistics operators.
By truck concentration, highways here outrank 63% of counties in Texas. At roughly 70 trucks per day, Edwards carries the lowest volume of highway trucks in Texas.
| Traffic | vehicles per day497 |
|---|---|
| Trucks | 13.2% |
| Average travel time | 40.2 min |
| Congestion ratio | 2.9% |
| Drivers’ average age | 45.3 yrs |
| Drivers’ average income | $38,777 |
Local roads carry more than half of all travel in Edwards County, Texas (60% of vehicle-miles). On the average non-highway road, that comes to 497 vehicles per day.
Local roads also make up about 56% of the monitored road miles: 88 miles in 344 segments, together carrying 38,450 vehicle-miles traveled per day (≈14.0 million per year). The truck share on non-highway roads is 13.2%.
Compared to highways, non-highway routes see 29% fewer trucks by share.
At 82% lower than the state level, the non-highway congestion ratio of 2.9% signals easier movement on local roads.
Edwards's average driver income is lower than 100% of counties in Texas. 85% of counties in Texas have a younger driver population than Edwards.
Edwards County's biggest difference from the Texas average is its average daily traffic per road, 92% below it. Its truck share, by contrast, is 57% above.
| Metric | Edwards County | Texas average | Difference |
|---|---|---|---|
| Traffic | 568 | 6,895 | -91.8% |
| Truck % (Total Traffic) | 15.3% | 9.8% | +56.8% |
| Truck % (Highway) | 18.5% | 13.8% | +34.7% |
| Avg. Travel Time | 36.1 min | 32.6 min | +10.6% |
Against the 4 nearest areas, Edwards County moves 15.3% of the total daily travel and carries 65.1% less traffic on a typical road; it has the quietest roads of the five. Quieter and more local than the areas around it on both counts: less traffic, and less of what there is arriving by truck.
| Area | Average daily traffic | Truck share | Daily vehicle-miles | Average travel time | Congestion ratio |
|---|---|---|---|---|---|
| Edwards County | 568 | 15.3% | 64,565 | 36.1 min | 3.1% |
| Real County, Texas | 1,190 | 10.5% | 74,282 | 35.8 min | 6.2% |
| Sutton County, Texas | 1,676 | 31.1% | 669,096 | 31.3 min | 5.0% |
| Kinney County, Texas | 1,686 | 17.1% | 208,136 | 45.8 min | 5.8% |
| Kimble County, Texas | 1,956 | 30.1% | 734,695 | 32.9 min | 6.3% |
| Texas average | 6,895 | 9.8% | N/A | 32.6 min | 16.4% |
No county-level area in Texas records a lower highway truck volume than Edwards County.
| Measure | Edwards County | Texas rank |
|---|---|---|
| Traffic volume (AADT) | 568 | #251 of 254 |
| Highway vehicle-miles per day | 26,114 | #222 of 227 |
| Truck share on highways | 18.5% | #84 of 227 |
| Highway trucks per day | 121 | #227 of 227 |
| Average travel time | 36.1 min | #101 of 254 |
| Average driver income | $41,120 | #253 of 254 |
| Average driver age | 50.1 yrs | #40 of 254 |
The two ends of this table sit far apart: #40 of 254 on average driver age, against #227 of 227 on highway truck volume.
The three busiest roads in Edwards County average 1,548 vehicles a day, 2.7 times the county average of 568 across all its monitored roads.
Main Street is the busiest road, at 2,200 vehicles a day, 281 of them trucks (12.8%). That is 80% more than the next road, US 377 (1,224). It also carries the most trucks.
Trips using TX 41 are long: a median of 74.7 minutes against 36.1 county-wide, the mark of a through route.
Drivers on TX 41 are noticeably younger, with a median age of 39.0 against 50.1 across the county.
The busiest stretch of Main Street carries 3.9 times the county average; trucks are 12.8% of it, below the county-wide 15.3%.
On its busiest stretch, US 377 carries 2.2 times the county average; trucks are 10.7% of it, below the county-wide 15.3%.
State Highway 55 peaks at 1,221 vehicles a day, 2.2 times the county average; trucks are 12.0% of it, below the county-wide 15.3%.
US 83 carries 92% more than the county average on its busiest stretch, where the median trip lasts 40.7 minutes.
Drivers on Del Rio Road are on long journeys, a median 47.2 minutes against 36.1 county-wide: a through route more than a local street.
TX 41 peaks at 722 vehicles a day, 27% more than the county average; trucks are 16.0% of it, in line with the county-wide 15.3%.
The average monitored road in Edwards carries 568 vehicles per day, 92% less than the Texas average of 6,895.
Yes - Edwards carries the lowest raw volume of highway trucks of any county in Texas, at roughly 70 trucks per day.
The average trip in Edwards takes 36.1 minutes, 11% longer than the Texas average of 32.6 minutes, delays at signals and congestion included.
Approximately 30% of highway traffic and 5% of non-highway traffic consists of vehicles whose trip originates outside Edwards County, Texas. A sizeable share of highway traffic comes from outside, mixed with local trips on the same roads.
Weekday traffic has two busy windows: AM peak 11:00 AM–12:00 PM and a long afternoon plateau from 12:00 PM to 4:00 PM - about 80% above the daily average.
Drivers on Edwards roads have a median age of 50 years, older than the Texas average of 42, and the median household income of the neighborhoods trips originate from averages $41,120, 55% below the Texas average.
Trucks make up about 15.3% of all traffic in Edwards County, Texas, rising to 18.5% on highways, where long-haul freight concentrates.
Main Street carries the most, 2,200 vehicles per day on its busiest stretch, followed by US 377 (1,224), State Highway 55 (1,221), US 83 (1,089), Del Rio Road (876). Figures are AADT, both directions combined.
Main Street, with about 281 trucks per day on its busiest stretch, 12.8% of its 2,200 vehicles.
About 2,200 vehicles per day in both directions on its busiest stretch, including 281 trucks (12.8%). Traffic is lower on its quieter stretches; TrafficZoom shows the count for every segment.

Mobile device location data (anonymized and aggregated)

Road sensor networks and traffic counters

Historical traffic pattern databases
The same traffic breakdown for the areas closest to Edwards County, Texas.
Identify traffic patterns street by street and analyze the exact corridors that matter to your project.
