
Need segment-level traffic data?
Identify traffic patterns street by street and analyze the exact corridors that matter to your project.
Traffic | vehicles per day6,501 |
|---|---|
Trucks | 23.4% |
Average travel time | 32.4 min |
Congestion ratio | 16.7% |
Drivers’ average age | 49.8 yrs |
Drivers’ average income | $56,552 |
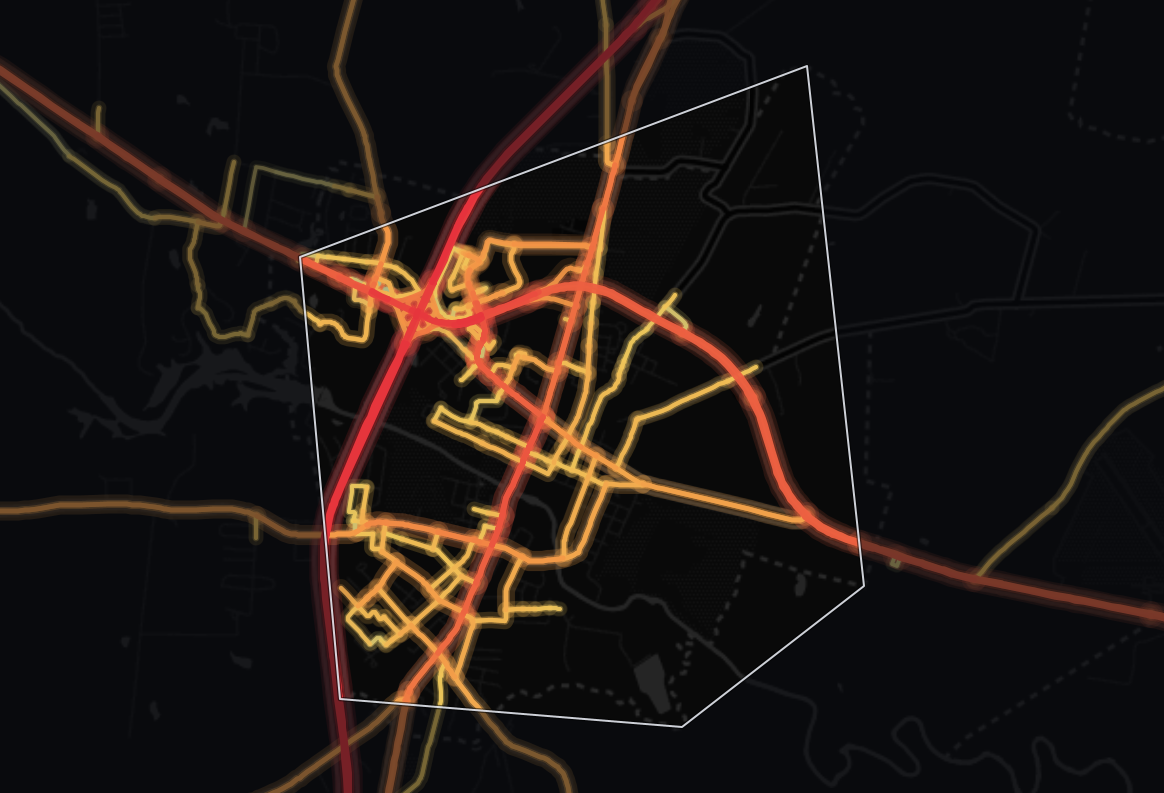
Our data shows 6,501 vehicles per day on the average road in Emporia City, Virginia, and 358,689 vehicle-miles traveled per day (≈131 million per year) across its 36 miles of monitored roads. About 1 in 4 vehicles is a truck, well above the 9.6% across Virginia - a freight-heavy mix.
Emporia's average daily traffic volume is 22% higher than the state average - 6,501 vehicles per day against 5,349 - suggesting more traffic load per road - a factor worth weighing in site selection and logistics planning. In total volume terms, its road network carries about 0.2% of Virginia's statewide total of vehicle-miles. 67% of counties in Virginia see less traffic than Emporia's 6,501 vehicles per day.
The average trip takes 32.4 minutes, on par with the state level. 58% of counties in Virginia have a shorter average travel time than Emporia's 32.4 minutes.
Congestion here (16.7%) closely tracks the state level.
| Traffic | vehicles per day13,151 |
|---|---|
| Trucks | 28.9% |
| Average travel time | 50.4 min |
| Congestion ratio | 31.2% |
| Drivers’ average age | 50.1 yrs |
| Drivers’ average income | $55,782 |
Most travel in Emporia City, Virginia happens on highways, 76% of all vehicle-miles. The average highway carries 13,151 vehicles per day, 136% more than the average non-highway road in the same area, which carries 5,566 vehicles per day.
Highways make up 45% of the monitored road miles (16 miles, 85 segments), so they carry more than their share: 272,752 vehicle-miles traveled per day (≈99.6 million per year).
The concentration of trucks on highways (28.9%) is 121% higher than the state average for similar road classifications. That marks Emporia as a major freight corridor, where highway access is what logistics operators compete on.
Emporia's highway truck share (28.9%) is higher than 98% of counties in Virginia. 91% of counties in Virginia see fewer highway trucks per day than Emporia's roughly 3,806.
| Traffic | vehicles per day5,566 |
|---|---|
| Trucks | 5.9% |
| Average travel time | 29.9 min |
| Congestion ratio | 14.7% |
| Drivers’ average age | 49.5 yrs |
| Drivers’ average income | $57,046 |
At 24% of vehicle-miles, local roads carry a smaller share of the traffic in Emporia City, Virginia than highways. A typical local road sees 5,566 vehicles per day.
Spread over 20 miles and 605 segments, 55% of the road network, local roads carry a lighter load per mile: 85,936 vehicle-miles traveled per day (≈31.4 million per year). Trucks make up 5.9% of non-highway traffic, about 1 in 17 vehicles.
The concentration of trucks on non-highway roads is 80% lower than on highways.
Non-highway congestion (14.7%) runs slightly lower than the state level (6% lower).
83% of counties in Virginia see higher average driver income among trip origins than Emporia. Emporia's median driver age is higher than 61% of counties in Virginia.


Mobile device location data (anonymized and aggregated)
Road sensor networks and traffic counters
Historical traffic pattern databases

Identify traffic patterns street by street and analyze the exact corridors that matter to your project.



