
Need segment-level traffic data?
Identify traffic patterns street by street and analyze the exact corridors that matter to your project.
Traffic | vehicles per day2,066 |
|---|---|
Trucks | 11.2% |
Average travel time | 36.1 min |
Congestion ratio | 6.0% |
Drivers’ average age | 51.5 yrs |
Drivers’ average income | $64,041 |
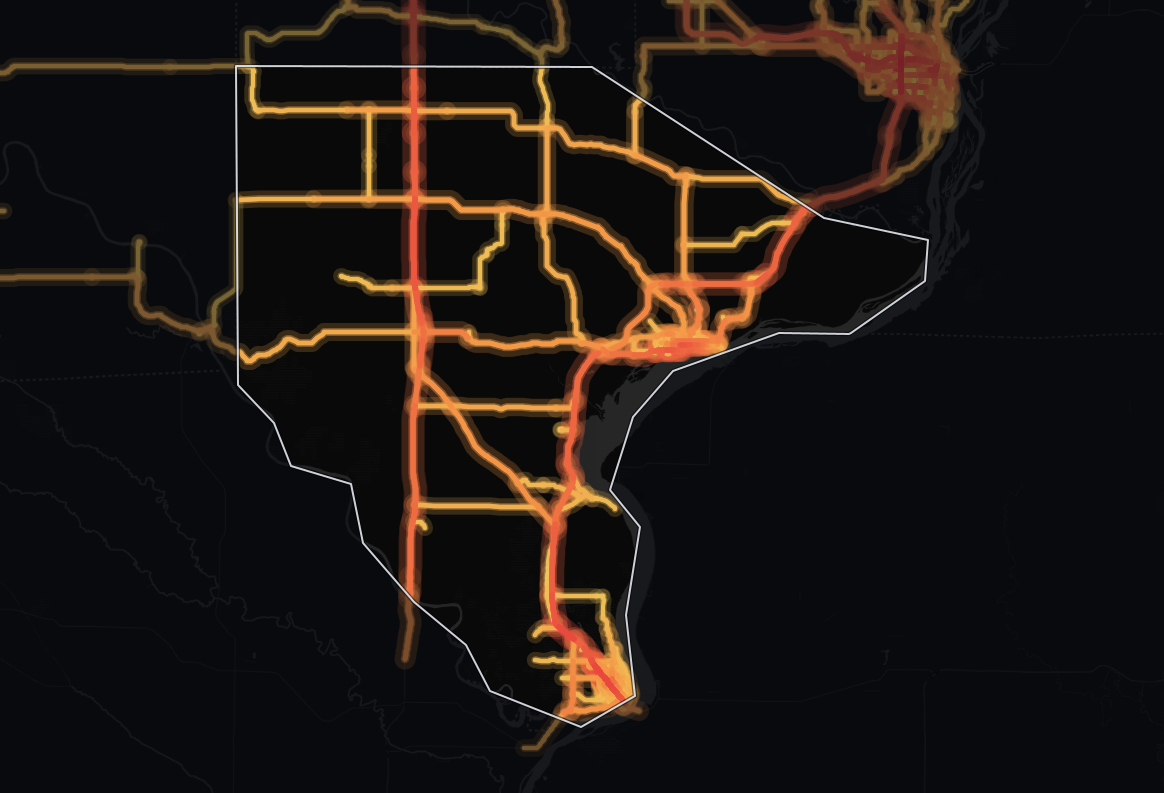
The average monitored road in Lee County, Iowa carries 2,066 vehicles per day. Across its 403 miles of monitored roads, that adds up to 764,760 vehicle-miles traveled per day (≈279 million per year). About 1 in 9 vehicles is a truck, in line with Iowa (11.0%).
At 2,066 vehicles per day, the average monitored road in Lee carries 32% less traffic than the state average of 3,042, suggesting less demand on each road - lighter roads for freight, but less passing trade for roadside retail. Across the whole network, that travel is about 0.9% of Iowa's statewide total. 69% of counties in Iowa see less traffic than Lee's 2,066 vehicles per day.
At 36.1 minutes, the average travel time is 10% higher than the state level. 78% of counties in Iowa have a shorter average travel time than Lee's 36.1 minutes.
The congestion ratio of 6.0% is 47% lower, pointing to smoother traffic flow than the state level - fewer delays make delivery windows more reliable.
| Traffic | vehicles per day3,413 |
|---|---|
| Trucks | 14.8% |
| Average travel time | 39.8 min |
| Congestion ratio | 7.7% |
| Drivers’ average age | 51.4 yrs |
| Drivers’ average income | $63,019 |
Travel in Lee County, Iowa splits roughly evenly, with about half of it (50% of vehicle-miles) on highways. The average highway carries 3,413 vehicles per day, 76% more than the average non-highway road in the same area, which carries 1,941 vehicles per day.
Highways make up 27% of the monitored road miles (109 miles, 259 segments), so they carry more than their share: 378,914 vehicle-miles traveled per day (≈138 million per year).
59% of counties in Iowa move less traffic on their highways.
The concentration of trucks on highways (14.8%) is 8% lower than the state average for similar road classifications. The highway traffic mix is typical for Iowa: neither freight- nor commuter-dominated.
55% of counties in Iowa see a lower highway truck share than Lee's 14.8%. By raw truck volume, Lee carries fewer highway trucks than 71% of counties in Iowa.
| Traffic | vehicles per day1,941 |
|---|---|
| Trucks | 7.6% |
| Average travel time | 35.8 min |
| Congestion ratio | 5.9% |
| Drivers’ average age | 51.5 yrs |
| Drivers’ average income | $64,483 |
Travel in Lee County, Iowa splits roughly evenly, with about half of it (50% of vehicle-miles) on local roads. On the average non-highway road, that comes to 1,941 vehicles per day.
Local roads make up 73% of the monitored road miles (294 miles in 2,778 segments) but carry less than their share of travel: 385,845 vehicle-miles traveled per day (≈141 million per year). Trucks make up 7.6% of non-highway traffic, about 1 in 13 vehicles.
The concentration of trucks on non-highway roads is 49% lower than on highways.
Non-highway congestion (5.9%) runs 47% lower than the state average, pointing to smoother local traffic flow.
91% of counties in Iowa see higher average driver income among trip origins than Lee. Lee's median driver age is higher than 73% of counties in Iowa.


Mobile device location data (anonymized and aggregated)
Road sensor networks and traffic counters
Historical traffic pattern databases

Identify traffic patterns street by street and analyze the exact corridors that matter to your project.



