
Need segment-level traffic data?

Identify traffic patterns street by street and analyze the exact corridors that matter to your project.
Get insights →
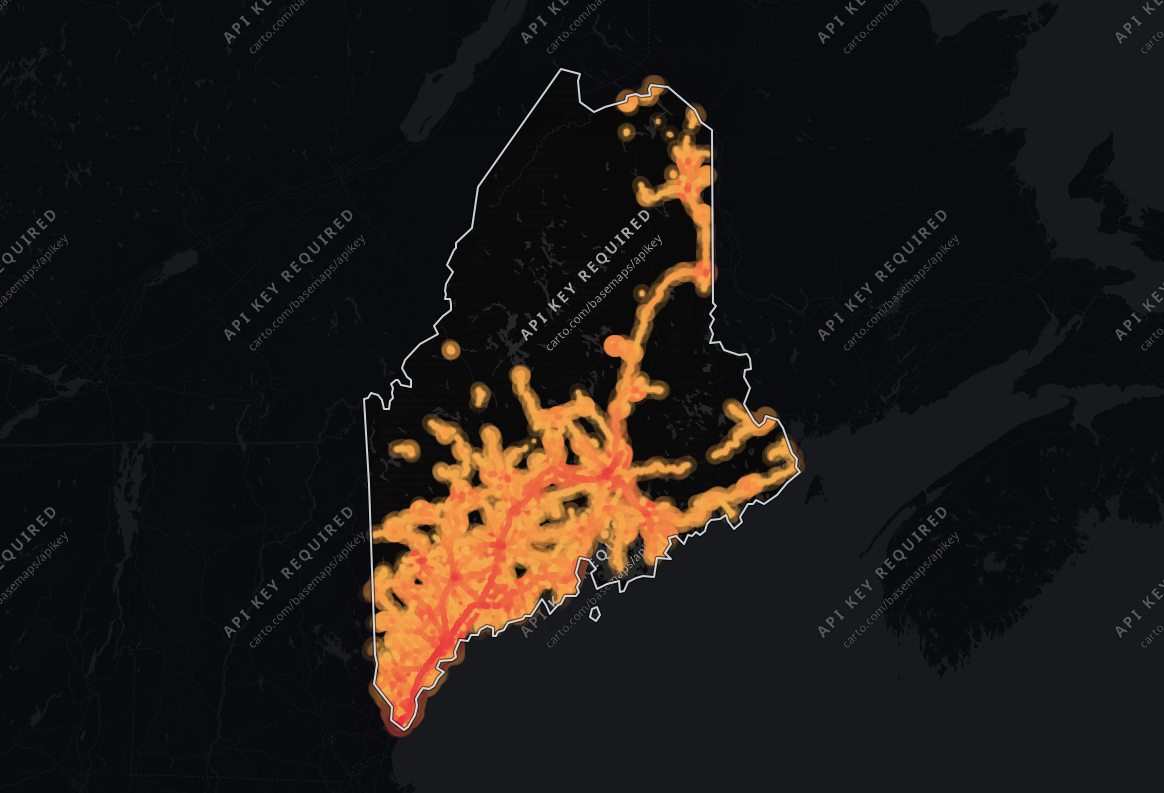
Traffic heat map of Maine: roads over 1,000 vehicles a day shaded from blue (light) to red (heavy traffic), busiest on I 95 and Maine Turnpike

Maine Traffic Counts

Our Maine traffic data covers 111,023 road segments over 8,426 road miles, with an average segment of just 401 ft. Its drivers are the oldest of any state nationwide, a median 50 years. Whether you are evaluating a new retail location, planning routes or assessing infrastructure, these numbers replace guesswork.
Data sourced from TrafficZoom's proprietary analytics platform.
Data current as of:
Q3 2026
Updated:
September 29, 2026
Find my place
total traffic icon

Total Traffic Volume & Performance in Maine

Traffic

The average number of vehicles that travel each day over any road in the road network.

vehicles per day4,836
Trucks

The percentage of the total traffic volume composed of heavy vehicles.

8.7%
Average travel time

The average time of travel averaged among all vehicles traveling on the road network.

34.6 min
Congestion ratio

The rate at which the actual travel time exceeds free-flow travel time, averaged among all roads in the network.

14.6%
Drivers’ average age

Average age of residents in the geographic areas where the vehicle trips originated.

50.3 yrs
Drivers’ average income

Average income of residents in the geographic areas where the vehicle trips originated.

$77,702

Our data shows 4,836 vehicles per day on the average road in Maine, and 32,675,550 vehicle-miles traveled per day (≈11.9 billion per year) across its 8,426 miles of monitored roads. Trucks are 8.7% of traffic, close to the 9.3% across the US.

Longer trips than 87% of states nationwide

Maine's average daily traffic volume is 31% lower than the national average - 4,836 vehicles per day against 6,986 - suggesting less traffic load per road - lighter roads for freight, but less passing trade for roadside retail. Across the whole network, that travel is about 0.4% of the national total. By volume, Maine's 4,836 vehicles per day trails 74% of states nationwide.

At 34.6 minutes, the average travel time matches the national level closely. Its average travel time of 34.6 minutes is longer than 87% of states nationwide.

At 23% lower than the national level, the 14.6% congestion ratio signals smoother traffic flow - crucial for traffic control improvement and logistics planning.

Highway vs. Non-Highway Traffic Analysis

highway traffic icon

Highway Traffic in Maine

Trafficvehicles per day8,989
Trucks12.3%
Average travel time41.2 min
Congestion ratio25.5%
Drivers’ average age51.5 yrs
Drivers’ average income$80,051

A significant share of driving in Maine, 35% of vehicle-miles, happens on highways. The average highway carries 8,989 vehicles per day, 101% more than the average non-highway road in the same area, which carries 4,469 vehicles per day.

Highways make up 16% of the monitored road miles (1,384 miles, 9,019 segments), so they carry more than their share: 11,559,445 vehicle-miles traveled per day (≈4.2 billion per year).

Fewer highway trucks than 86% of states nationwide

At 12.3%, highway truck share is 6% lower than the national average. The highway traffic mix is typical for the US: neither freight- nor commuter-dominated.

58% of states nationwide see a higher highway truck share than Maine's 12.3%. Maine's highway truck count is lower than 86% of states nationwide, at roughly 1,110 trucks per day.

non-highway traffic icon

Non-highway Traffic in Maine

Trafficvehicles per day4,469
Trucks6.7%
Average travel time34.1 min
Congestion ratio13.9%
Drivers’ average age50.1 yrs
Drivers’ average income$76,571

A little more than half of the driving in Maine happens on local roads: 65% of all vehicle-miles. The average non-highway road carries 4,469 vehicles per day.

Spread over 7,042 miles and 102,004 segments, 84% of the road network, local roads carry a lighter load per mile: 21,116,106 vehicle-miles traveled per day (≈7.7 billion per year). Trucks make up 6.7% of non-highway traffic, about 1 in 15 vehicles.

The oldest drivers of any state nationwide

Non-highway roads carry a truck concentration that's 46% lower than the highway network.

At 24% lower than the national level, the non-highway congestion ratio of 13.9% signals easier movement on local roads.

Maine's average driver income is lower than 76% of states nationwide. At 50 years, Maine's median driver age is the highest nationwide.

Time-of-Day & Seasonal Patterns

peak hours icon
Peak Traffic Windows
Weekday peaks:
AM peak 10:00 AM–12:00 PM and a long afternoon plateau from 12:00 PM to 6:00 PM, with volumes reaching approximately 72% higher than the daily average.
Weekend traffic:
Weekends are somewhat quieter: volumes run about 16% below weekday levels, the usual weekend dip.
seasonal traffic icon
Seasonal Fluctuation
Busy season:
June–August is the high season, with volumes +18% versus the annual average.
Lowest month:
January is the quietest month, with volumes -21% versus the annual average - the usual winter low.

Data Finding: Hourly & Seasonal Patterns

In Maine, the peak hour concentrates about 7% of the day's traffic, and there is a strong seasonal swing of +18% in high season.

Maine vs. United States Traffic Comparison

Of the four measures, average daily traffic per road differs most: Maine runs 31% below the United States average.

MetricMaineUnited States averageDifference
Traffic4,8366,986-30.8%
Truck % (Total Traffic)8.7%9.3%-6.8%
Truck % (Highway)12.3%13.1%-5.5%
Avg. Travel Time34.6 min33.3 min+4.0%

How Maine compares

Maine against nearby states

Against the 4 nearest states, Maine is 25.1% less congested; it has the fourth busiest roads of the five. Less traffic and more room for it - the roads here run both quieter and freer than the states around them.

Maine and the 4 nearest states by centroid distance, with the United States average for scale.
StateAverage daily trafficTruck shareDaily vehicle-milesAverage travel timeCongestion ratio
Maine4,8368.7%32,675,55034.6 min14.6%
New Hampshire5,6697.0%32,761,09132.7 min17.5%
Vermont4,0278.5%15,079,46132.7 min13.2%
Massachusetts8,1666.9%136,116,24234.4 min24.0%
Rhode Island7,8707.0%19,159,97535.2 min23.3%
United States average6,9869.3%N/A33.3 min18.9%

Busiest counties in Maine

Together, those three counties carry 46.5% of all the vehicle-miles measured in the state.

Ranked by daily vehicle-miles, across the 16 counties in Maine with a published traffic page. Vehicle-miles is total travel, so this ranks by traffic MOVED rather than by how busy a typical road is.
CountyDaily vehicle-milesAverage daily trafficTruck shareRoad miles
1. Cumberland County6,382,3806,6868.1%923
2. York County4,922,1365,4969.0%798
3. Penobscot County3,894,0505,0259.6%1,058

Most truck-intensive counties in Maine

Together, those five counties carry 39.4% of the truck vehicle-miles driven in the state.

Ranked by truck share of all traffic, across the same 16 counties, shown with the traffic volume that share is measured against.
CountyTruck shareTruck share on highwaysAverage daily trafficDaily vehicle-miles
1. Aroostook County10.3%16.3%3,0211,628,975
2. Sagadahoc County10.3%12.6%4,3041,256,434
3. Somerset County9.7%12.7%3,2951,529,066
4. Penobscot County9.6%13.0%5,0253,894,050
5. Kennebec County9.1%14.1%5,3033,288,041

Asking the same question of truck vehicle-miles gives a different answer - Cumberland County, York County, Penobscot County, Kennebec County and Aroostook County, together 63.4% of all truck travel in Maine.

Busiest roads in Maine

On their busiest stretches, the three busiest roads in Maine carry 36,665 vehicles a day on average, 7.6 times the typical road in the state (4,836).

I 95 in Penobscot County is the busiest road, at 38,709 vehicles a day, 3,126 of them trucks (8.1%). Maine Turnpike in York County is practically level with it at 38,298. Maine Turnpike in York County carries the most trucks, 5,756 a day (15.0% of its traffic), although it ranks #2 for all traffic.

I 95 in Kennebec County carries longer journeys than most roads here, with a median trip of 57.6 minutes against 34.6 state-wide.

Route 1 in Cumberland County draws drivers from wealthier areas: their neighborhoods average $114,370 in household income, 47% above the state's $77,702.

Trucks make up 16.7% of traffic on I 95 in York County and 16.2% on I 295 in Kennebec County, against 8.7% across all roads in the state.

Ranked by daily traffic (AADT)

Cars and light vehiclesTrucks
1I 95Penobscot County · Motorway · 38,709vehicles3,126trucks · 8.1%
Road class
Motorway
Congestion ratio
39.4%
Median trip time
34.9 min
Drivers’ median age
48.3 yrs
Drivers’ average income
$78,687

I 95 is a trunk route for the state, carrying 8.0 times the state average on its busiest stretch; trucks are 8.1% of it, below the state-wide 8.7%.

2Maine TurnpikeYork County · Motorway · 38,298vehicles5,756trucks · 15.0%
Road class
Motorway
Congestion ratio
25.4%
Median trip time
52.9 min
Drivers’ median age
51.6 yrs
Drivers’ average income
$96,410

Maine Turnpike carries 7.9 times the state average at its busiest, 5,756 of them trucks (15.0%, above the state-wide 8.7%).

3I 95York County · Motorway · 32,989vehicles5,510trucks · 16.7%
Road class
Motorway
Congestion ratio
28.2%
Median trip time
54.7 min
Drivers’ median age
54.5 yrs
Drivers’ average income
$107,394

I 95 carries through traffic: the median trip using it lasts 54.7 minutes, against 34.6 for the state.

4I 295Cumberland County · Motorway · 32,742vehicles2,698trucks · 8.2%
Road class
Motorway
Congestion ratio
39.0%
Median trip time
37.6 min
Drivers’ median age
48.3 yrs
Drivers’ average income
$100,428

I 295 carries 6.8 times the state average on its busiest stretch, where the median trip lasts 37.6 minutes.

5Vietnam Veterans Memorial BridgeAndroscoggin County · Primary road · 29,284vehicles1,198trucks · 4.1%
Road class
Primary road
Congestion ratio
41.4%
Median trip time
33.7 min
Drivers’ median age
48.7 yrs
Drivers’ average income
$71,488

Travel on Vietnam Veterans Memorial Bridge's busiest stretch runs 41% over free-flow time, against 15% across the state, so expect slower peak hours.

6I 395Penobscot County · Motorway · 29,271vehicles2,738trucks · 9.4%
Road class
Motorway
Congestion ratio
38.6%
Median trip time
32.3 min
Drivers’ median age
48.4 yrs
Drivers’ average income
$79,007

At 6.1 times the state average, I 395 draws drivers from neighborhoods averaging $79,007 in household income.

7Route 1Cumberland County · Primary road · 28,511vehicles1,459trucks · 5.1%
Road class
Primary road
Congestion ratio
29.4%
Median trip time
29.2 min
Drivers’ median age
48.9 yrs
Drivers’ average income
$114,370

A main artery: Route 1's busiest stretch carries 5.9 times the state average; trucks are 5.1% of it, below the state-wide 8.7%.

8Court StreetAndroscoggin County · Primary road · 28,208vehicles1,420trucks · 5.0%
Road class
Primary road
Congestion ratio
37.3%
Median trip time
46.9 min
Drivers’ median age
48.0 yrs
Drivers’ average income
$71,457

Court Street is a trunk route for the state, carrying 5.8 times the state average on its busiest stretch; trucks are 5.0% of it, below the state-wide 8.7%.

9Maine TurnpikeCumberland County · Motorway · 27,724vehicles4,240trucks · 15.3%
Road class
Motorway
Congestion ratio
27.9%
Median trip time
44.2 min
Drivers’ median age
49.1 yrs
Drivers’ average income
$95,887

A freight route: trucks are 15.3% of the traffic on Maine Turnpike's busiest stretch, 1.8 times the state-wide 8.7%.

10Pleasant StreetCumberland County · Trunk road · 27,387vehicles1,799trucks · 6.6%
Road class
Trunk road
Congestion ratio
42.1%
Median trip time
38.9 min
Drivers’ median age
50.7 yrs
Drivers’ average income
$85,903

Pleasant Street is one of the more congested roads here: trips take 42% longer than at free-flow speed, against 15% state-wide.

Ranked by trucks per day

Cars and light vehiclesTrucks
1Maine TurnpikeYork County · Motorway · #2 by traffic38,298vehicles5,756trucks · 15.0%
2I 95York County · Motorway · #3 by traffic32,989vehicles5,510trucks · 16.7%
3Maine TurnpikeCumberland County · Motorway · #9 by traffic27,724vehicles4,240trucks · 15.3%
4I 295Sagadahoc County · Motorway · 26,426vehicles3,736trucks · 14.1%
Road class
Motorway
Congestion ratio
22.6%
Median trip time
49.3 min
Drivers’ median age
50.3 yrs
Drivers’ average income
$80,746

I 295 carries 5.5 times the state average at its busiest, 3,736 of them trucks (14.1%, above the state-wide 8.7%).

5I 95Somerset County · Motorway · 21,176vehicles3,417trucks · 16.1%
Road class
Motorway
Congestion ratio
21.8%
Median trip time
56.2 min
Drivers’ median age
48.4 yrs
Drivers’ average income
$66,950

Drivers on I 95 are on long journeys, a median 56.2 minutes against 34.6 state-wide: a through route more than a local street.

6I 295Kennebec County · Motorway · 19,950vehicles3,233trucks · 16.2%
Road class
Motorway
Congestion ratio
24.8%
Median trip time
52.4 min
Drivers’ median age
50.3 yrs
Drivers’ average income
$77,152

I 295 carries 4.1 times the state average at its busiest, 3,233 of them trucks (16.2%, above the state-wide 8.7%).

7I 95Penobscot County · Motorway · #1 by traffic38,709vehicles3,126trucks · 8.1%
8I 95Kennebec County · Motorway · 20,017vehicles2,817trucks · 14.1%
Road class
Motorway
Congestion ratio
19.5%
Median trip time
57.6 min
Drivers’ median age
47.6 yrs
Drivers’ average income
$66,642

I 95 carries 4.1 times the state average on its busiest stretch, where the median trip lasts 57.6 minutes.

9I 395Penobscot County · Motorway · #6 by traffic29,271vehicles2,738trucks · 9.4%
10I 295Cumberland County · Motorway · #4 by traffic32,742vehicles2,698trucks · 8.2%
How to read these road counts
  • The first number is AADT, annual average daily traffic: the vehicles passing a point on an average day, both directions combined and trucks included. On a divided highway both carriageways are added together.
  • Traffic changes along a road, with more near interchanges and towns and less in open country. Every figure for a road describes its busiest stretch in the county, so the two rankings show the same numbers for the same road.
  • The second number is the trucks on that stretch, a part of its AADT. The bar splits the AADT into cars and light vehicles (blue) and trucks (amber).
  • See segment-level AADT for any road on TrafficZoom.

Data Sources & Methodology

The data presented on this page is derived from TrafficZoom's proprietary analytics platform, which aggregates and normalizes information from multiple sources, including:

Mobile device location data (anonymized and aggregated)

Road sensor networks and traffic counters

Historical traffic pattern databases

Public traffic count programs published by the

MaineDepartment of Transportation

Demographic Baseline for O-D Modeling

U.S. Census Bureau
All metrics represent estimates based on statistical modeling and are intended for strategic planning purposes.
link arrow icon
Data current as of:
Q3 2026

Explore further

TrafficZoom platform

— street-level analytics and custom corridor reports.

Map AI

— demographics, housing and mobility data.

States near Maine

The same traffic breakdown for the states closest to Maine.

Need segment-level traffic data?

Identify traffic patterns street by street and analyze the exact corridors that matter to your project.

Counties in Maine

Traffic counts, truck share, congestion and driver demographics for each of the 16 counties TrafficZoom measures in Maine.