
Need segment-level traffic data?

Identify traffic patterns street by street and analyze the exact corridors that matter to your project.
Get insights
traffic map

Stephens County, Texas Traffic Counts

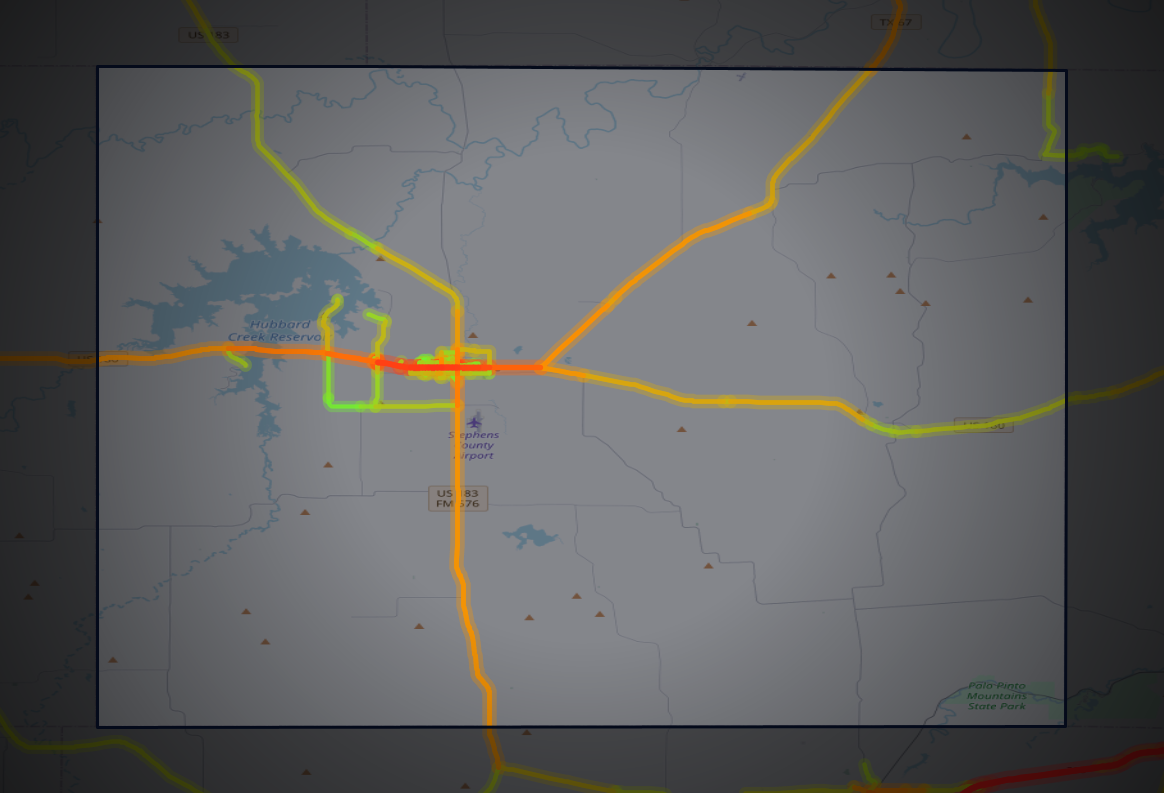
This page delivers traffic analytics for Stephens County, Texas. Our metrics are calculated with multi-sourced, cross-verified data from real-world mobile and sensor networks, and averaged for Stephens County, Texas among 207 road miles divided in 1,030 segments. Our metrics go beyond simple volume counts to provide actionable insights on traffic intensity, congestion, commercial vehicle flow, and network performance with highest possible granularity (average segment length is 1,059 ft). Whether you are evaluating a new retail location, planning logistics routes, or assessing infrastructure needs, this data helps you move from assumptions to certainty.
Data sourced from TrafficZoom's proprietary analytics platform.
Data current as of:
Q3 2026
Find my place
total traffic icon

Total Traffic Volume & Performance

Traffic

2,007

Trucks

9.0%

Average travel time

34.2 min

Congestion ratio

6.1%

Drivers’ average age

49.4 yrs

Drivers’ average income

$60,060

Our data indicates an estimated average traffic volume of 2,007 vehicles per day in Stephens County, Texas that results in 226,960 vehicle-miles traveled per day (≈82.8 million per year). The traffic stream is comprised of an average of 1 truck for every 11 vehicles. Typical time spent behind the wheel per trip is 34.2 minutes, which already accounts for delays at signals, intersections, and congestion.

Analytical insight

When compared to the Texas state averages: Stephens sees 71% lower average daily traffic volume than the state average (2,007 vehicles per day against 6,895), suggesting less demand on each road - a critical factor for logistics and site planning. In total volume terms, its road network carries 226,960 vehicle-miles traveled per day (≈82.8 million per year), about 0.0% of Texas's statewide total. At 34.2 minutes, the average travel time is 5% higher than the state level. The congestion ratio of 6.1% is 62% lower, pointing to smoother traffic flow than the state level - crucial for traffic control improvement and logistics planning. 26% of counties in Texas see less traffic than Stephens's 2,007 vehicles per day. On travel time, Stephens runs longer than 45% of counties in Texas.

Highway vs. Non-Highway Traffic Analysis

Analytical insight

N/A
non-highway traffic icon

Non-highway traffic

Traffic

2,007

Trucks

9.0%

Average travel time

34.2 min

Congestion ratio

6.1%

Drivers’ average age

49.4 yrs

Drivers’ average income

$60,060

The non-highway road network in Stephens County, Texas supports a substantial volume of traffic. The average non-highway road carries 2,007 vehicles per day. That average covers 207 non-highway road miles divided in 1,030 segments (average segment length 1,059 ft), together carrying 226,960 vehicle-miles traveled per day (≈82.8 million per year). Trucks constitute 9.0% of non-highway traffic.

Analytical insight

At 62% lower than the state level, the non-highway congestion ratio of 6.1% signals easier movement on local roads. 45% of counties in Texas see shorter overall travel times than Stephens. 18% of counties in Texas see lower average driver income among trip origins than Stephens. The driver population here skews older than 80% of counties in Texas.

Time-of-Day & Seasonal Patterns

peak hours icon
Peak Traffic Windows
Weekday peaks:
AM peak 10:00 AM–12:00 PM and PM peak 4:00 PM–6:00 PM, with volumes reaching approximately 75% higher than the daily average.
Weekend traffic:
Weekend volumes run about 18% below weekday levels.
seasonal traffic icon
Seasonal Fluctuation
Busy season:
March–May is the high season, with volumes +3% versus the annual average.
Lowest month:
February is the quietest month, with volumes -11% versus the annual average.

Analytical insight

In Stephens County, Texas, the peak hour concentrates about 7% of the day's traffic, and seasonal swing is mild at +3% in high season.

Traffic Flow Profile Comparison

Metric

Stephens

Texas
Average

Difference

Traffic

2,007

6,895

-70.9%

Truck % (Total Traffic)

9.0%

9.8%

-8.2%

Truck % (Highway)

13.8%

Avg. Travel Time

34.2 min

32.6 min

+4.8%

How Stephens County compares

Stephens County against nearby areas

Compared with its 4 closest neighbours, Stephens County moves 49.5% of the total daily travel; it has the third busiest roads of the five.

Stephens County and the 4 nearest county-level areas by centroid distance, with the Texas average for scale.
AreaAverage daily trafficTruck shareDaily vehicle-milesAverage travel timeCongestion ratio
Stephens County2,0079.0%226,96034.2 min6.1%
Young County, Texas2,0909.2%382,99330.0 min7.7%
Palo Pinto County, Texas2,70115.5%1,240,56436.5 min8.0%
Shackelford County, Texas1,34310.8%150,47438.0 min5.0%
Throckmorton County, Texas63111.6%59,83243.5 min2.4%
Texas average6,8959.8%N/A32.6 min16.4%

Stephens County ranked within Texas

Stephens County sits in the bottom quarter of the Texas field on average driver income, at #209 of 254.

Where Stephens County sits among Texas's county-level areas on each measure. Rank 1 is the highest value in the state, whether or not that is the outcome you want; the field size differs by measure because not every county carries highway data.
MeasureStephens CountyTexas rank
Traffic volume (AADT)2,007#187 of 254
Average travel time34.2 min#140 of 254
Average driver income$60,060#209 of 254
Average driver age49.4 yrs#51 of 254

The two ends of this table sit far apart: #51 of 254 on average driver age, against #209 of 254 on average driver income.

Data Sources & Methodology

The data presented on this page is derived from TrafficZoom's proprietary analytics platform, which aggregates and normalizes information from multiple sources, including:

Mobile device location data (anonymized and aggregated)

Road sensor networks and traffic counters

Historical traffic pattern databases

Public traffic count programs published by the

TexasDepartment of Transportation

Historical traffic pattern databases

U.S. Census Bureau
All metrics represent estimates based on statistical modeling and are intended for strategic planning purposes.
link arrow icon
Data current as of:
Q3 2026

Explore further

TrafficZoom platform

— street-level analytics and custom corridor reports.

Map AI

— demographics, housing and mobility data.

Counties near Stephens County

The same traffic breakdown for the areas closest to Stephens County, Texas.

Need segment-level traffic data?

Identify traffic patterns street by street and analyze the exact corridors that matter to your project.
