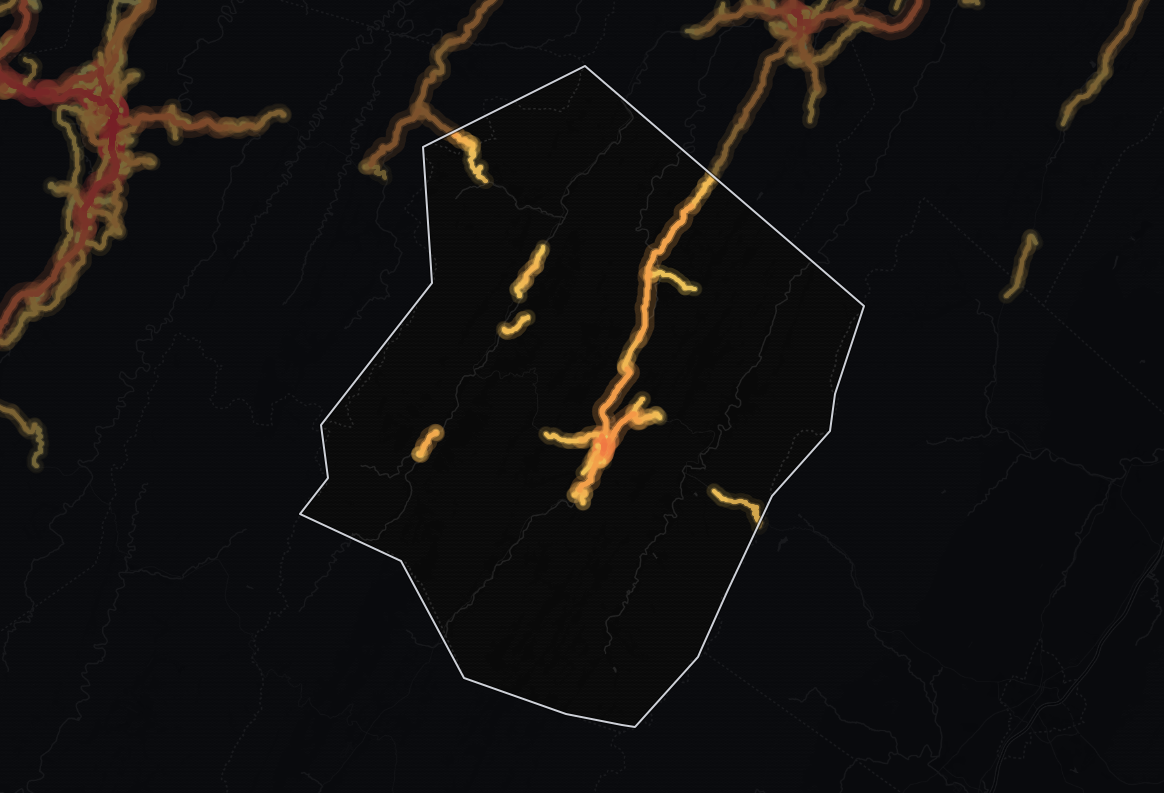
Trips here are the shortest of any county in West Virginia, a median 20.9 minutes. This page breaks down traffic in Pendleton County, West Virginia across 70 miles of monitored roads split into 890 segments, using multi-sourced mobile and sensor data. It goes beyond raw counts to truck flow, congestion and who is driving, so site selection and route planning rest on evidence.
Data sourced from TrafficZoom's proprietary analytics platform.
Total Traffic Volume & Performance in Pendleton County, West Virginia
Traffic
The average number of vehicles that travel each day over any road in the road network.
vehicles per day2,252
Trucks
The percentage of the total traffic volume composed of heavy vehicles.
11.6%
Average travel time
The average time of travel averaged among all vehicles traveling on the road network.
20.9 min
Congestion ratio
The rate at which the actual travel time exceeds free-flow travel time, averaged among all roads in the network.
7.0%
Drivers’ average age
Average age of residents in the geographic areas where the vehicle trips originated.
56.3 yrs
Drivers’ average income
Average income of residents in the geographic areas where the vehicle trips originated.
$63,890
Our data shows 2,252 vehicles per day on the average road in Pendleton County, West Virginia, and 110,095 vehicle-miles traveled per day (≈40.2 million per year) across its 70 miles of monitored roads. About 1 in 9 vehicles is a truck, in line with West Virginia (11.0%).
The shortest trips of any county in West Virginia
Pendleton sees 69% lower average daily traffic volume than the state average (2,252 vehicles per day against 7,367), suggesting less demand on each road - quiet roads that suit freight movement more than drive-by retail. Across the whole network, that travel is about 0.1% of West Virginia's statewide total. Pendleton carries less traffic than 96% of counties in West Virginia.
Journey times run 32% lower than the state level, at 20.9 minutes on average. It also posts the lowest average travel time in West Virginia, at 20.9 minutes.
At 68% lower than the state level, the 7.0% congestion ratio signals smoother traffic flow - delays are rare enough to plan travel times almost to the minute.
Time-of-Day & Seasonal Patterns
Data Finding: Hourly & Seasonal Patterns
In Pendleton County, West Virginia, the peak hour concentrates about 8% of the day's traffic.
Pendleton County vs. West Virginia Traffic Comparison
Pendleton County's biggest difference from the West Virginia average is its average daily traffic per road, 69% below it. Its average travel time is also 32% below.
Metric
Pendleton County
West Virginia average
Difference
Traffic
2,252
7,367
-69.4%
Truck % (Total Traffic)
11.6%
11.0%
+4.9%
Avg. Travel Time
20.9 min
30.8 min
-32.2%
How Pendleton County compares
Pendleton County is the least congested of its nearby counties
Against the 4 nearest areas, Pendleton County moves 8.9% of the total daily travel and sees 43.5% shorter typical trips; it has the fourth busiest roads of the five. It is the quiet one of the group - below the areas around it on volume, total travel and trip length alike.
Pendleton County and the 4 nearest county-level areas by centroid distance, with the West Virginia average for scale.
On average driver age, Pendleton County is among the three highest county-level areas in West Virginia.
Pendleton County ranked among 55 county-level areas in West Virginia (1 = highest).
Measure
Pendleton County
West Virginia rank
Traffic volume (AADT)
2,252
#53 of 55
Average travel time
20.9 min
#55 of 55
Average driver income
$63,890
#13 of 55
Average driver age
56.3 yrs
#2 of 55
The two ends of this table sit far apart: #2 of 55 on average driver age, against #55 of 55 on average travel time.
Busiest roads in Pendleton County, West Virginia
On their busiest stretches, the three busiest roads in Pendleton County carry 4,328 vehicles a day on average, 92% more than the typical road in the county (2,252).
Main Street is the busiest road, at 7,399 vehicles a day, 708 of them trucks (9.6%). No other road comes close: Mount Freedom Drive, in second place, carries 2,967. It tops the truck ranking too, with the most trucks.
Freight stands out on Whites Run Road and Germany Valley Road: trucks are 100.0% and 26.2% of the traffic there, against 11.6% county-wide.
Trips using Germany Valley Road are long: a median of 104.2 minutes against 20.9 county-wide, the mark of a through route.
Mount Freedom Drive draws drivers from lower-income areas: their neighborhoods average $35,417 in household income, 45% below the county's $63,890.
Even at its busiest, Blue Gray Trail carries 27% less than the county average; trucks are 9.0% of it, below the county-wide 11.6%.
Ranked by trucks per day
Cars and light vehiclesTrucks
1Main StreetPrimary road · #1 by traffic7,399vehicles708trucks · 9.6%
2Whites Run RoadTertiary road · 309vehicles309trucks · 100.0%
Road class
Tertiary road
Whites Run Road is a quieter road: its busiest stretch carries 86% less than the county average; trucks are 100.0% of it, above the county-wide 11.6%.
3US 33Primary road · #4 by traffic2,129vehicles295trucks · 13.9%
4Petersburg PikePrimary road · #3 by traffic2,619vehicles288trucks · 11.0%
5Germany Valley RoadTertiary road · 846vehicles222trucks · 26.2%
Road class
Tertiary road
Median trip time
104.2 min
Drivers’ median age
61.2 yrs
Drivers’ average income
$71,458
Even at its busiest, Germany Valley Road carries 62% less than the county average; trucks are 26.2% of it, above the county-wide 11.6%.
How to read these road counts
The first number is AADT, annual average daily traffic: the vehicles passing a point on an average day, both directions combined and trucks included. On a divided highway both carriageways are added together.
Traffic changes along a road, with more near interchanges and towns and less in open country. Every figure for a road describes its busiest stretch in the county, so the two rankings show the same numbers for the same road.
The second number is the trucks on that stretch, a part of its AADT. The bar splits the AADT into cars and light vehicles (blue) and trucks (amber).
The average monitored road in Pendleton carries 2,252 vehicles per day, 69% less than the West Virginia average of 7,367.
Yes - at 20.9 minutes, Pendleton has the lowest average travel time of any county in West Virginia.
Drivers on Pendleton roads have a median age of 56 years, older than the West Virginia average of 49, and the median household income of the neighborhoods trips originate from averages $63,890, in line with the West Virginia average.
Approximately 3% of measured traffic consists of vehicles whose trip originates outside Pendleton County, West Virginia.
The average trip in Pendleton takes 20.9 minutes, 32% shorter than the West Virginia average of 30.8 minutes, delays at signals and congestion included.
Weekday traffic has two busy windows: AM peak 7:00 AM–8:00 AM and PM peak 4:00 PM–6:00 PM - about 89% above the daily average.
Trucks make up about 11.6% of all traffic in Pendleton County, West Virginia.
Main Street carries the most, 7,399 vehicles per day on its busiest stretch, followed by Mount Freedom Drive (2,967), Petersburg Pike (2,619), US 33 (2,129), Blue Gray Trail (1,640). Figures are AADT, both directions combined.
Main Street, with about 708 trucks per day on its busiest stretch, 9.6% of its 7,399 vehicles.
About 7,399 vehicles per day in both directions on its busiest stretch, including 708 trucks (9.6%). Traffic is lower on its quieter stretches; TrafficZoom shows the count for every segment.
Data Sources & Methodology
The data presented on this page is derived from TrafficZoom's proprietary analytics platform, which aggregates and normalizes information from multiple sources, including:
Mobile device location data (anonymized and aggregated)