TrafficZoom Team
September 8, 2026
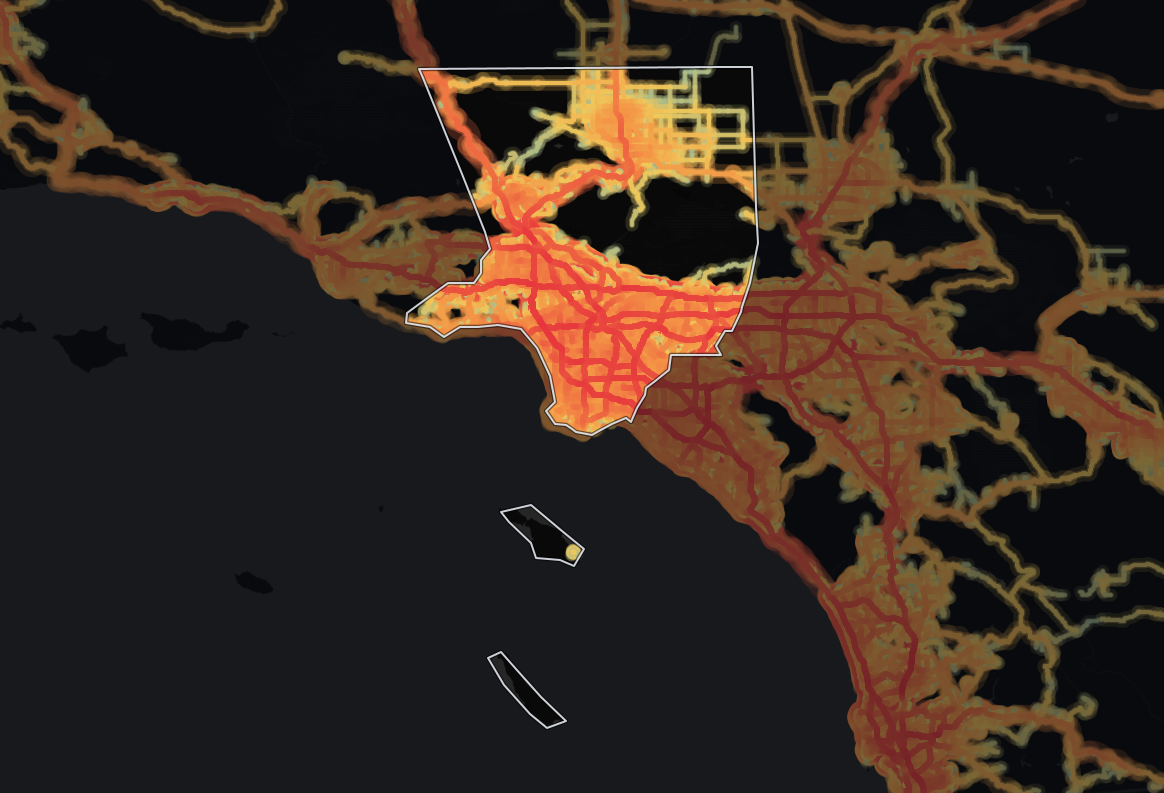
Fifteen counties out of 3,131 carry 14.4% of all the driving in the United States. They hold 5.5% of the country's road.
County traffic concentrates far harder than state traffic does. We looked at the ten states that carry half of America's driving and found their roads run 16% busier than the national average. Do the same at county level and the multiple is five times larger. The fifteen counties below average 12,916 vehicles per day on a typical road, against 6,986 nationally.
The ranking is by daily vehicle-miles travelled, the total workload on a county's road network. Average AADT, the busyness of a typical road there, is in the table too. Two states supply ten of the fifteen entries, and the county with the heaviest truck traffic sits in the state with the lightest.
| # | County | Daily VMT (M) | Share of US | Avg AADT | Truck share | Road miles |
|---|---|---|---|---|---|---|
| 1 | Los Angeles County, California | 204.5 | 2.69% | 19,000 | 6.0% | 8,894 |
| 2 | Harris County, Texas | 107.1 | 1.41% | 10,080 | 6.8% | 7,466 |
| 3 | Maricopa County, Arizona | 98.1 | 1.29% | 11,870 | 6.8% | 7,385 |
| 4 | San Diego County, California | 85.1 | 1.12% | 14,311 | 5.5% | 4,209 |
| 5 | Riverside County, California | 71.5 | 0.94% | 12,881 | 8.5% | 4,160 |
| 6 | San Bernardino County, California | 71.1 | 0.94% | 12,150 | 11.5% | 5,033 |
| 7 | Orange County, California | 68.6 | 0.90% | 15,435 | 4.9% | 3,284 |
| 8 | Dallas County, Texas | 64.5 | 0.85% | 7,931 | 8.1% | 4,874 |
| 9 | Cook County, Illinois | 63.8 | 0.84% | 14,119 | 7.1% | 3,934 |
| 10 | Miami-Dade County, Florida | 47.8 | 0.63% | 12,935 | 6.0% | 2,983 |
| 11 | Tarrant County, Texas | 46.0 | 0.61% | 8,475 | 7.2% | 3,735 |
| 12 | Santa Clara County, California | 42.0 | 0.55% | 13,366 | 5.5% | 2,038 |
| 13 | Bexar County, Texas | 41.9 | 0.55% | 10,939 | 7.3% | 2,931 |
| 14 | King County, Washington | 40.8 | 0.54% | 10,724 | 5.9% | 2,742 |
| 15 | Clark County, Nevada | 40.5 | 0.53% | 9,520 | 7.9% | 3,987 |
| Top 15 combined | 1,093.2 | 14.4% | 12,916 | 6.9% | 67,653 | |
| United States | 7,593.8 | 100% | 6,986 | 9.3% | 1,223,095 |
Truck share is the proportion of all traffic made up of commercial vehicles, across every road class. Road miles are true centerline miles, not lane-miles or directional miles. The combined row is recombined the way our state and national roll-ups are: AADT weighted by segment count, truck share by vehicle-miles, road miles summed. National context sits on the United States traffic data page.
Los Angeles County moves 204.5 million vehicle-miles on an average day. Line that up against the state ranking and it would come 12th of 51, ahead of Tennessee, Arizona, Indiana and 37 others. Only eleven states carry more driving than this single county.
It is also nearly twice the size of the next county on the list. Harris County, Texas, which contains Houston, carries 107.1 million, and the gap between first and second place is wider than the gap between second and eighth.
Los Angeles achieves this on 8,894 centerline miles, with the busiest roads in the top fifteen at 19,000 vehicles per day and the worst congestion at 33.4% against a national 18.9%. It is the clearest example in the dataset of demand outrunning the network it runs on.
California places six counties in the top fifteen and Texas four. The other five come from Arizona, Illinois, Florida, Washington and Nevada, one each.
The California cluster is not just Los Angeles. San Diego, Riverside, San Bernardino, Orange and Santa Clara are all here, and together the six California counties carry more daily travel than any state except California itself and Texas. That is what a single state ranking first nationally on both total travel and average road busyness looks like from underneath.
Across the fifteen, trucks are 6.9% of traffic against a national 9.3%. The busiest counties in America are markedly lighter on freight than the country as a whole, and the reason is straightforward: what makes a county busy is commuters. The same effect shows up one level up in the state ranking, but weaker, because a state contains its own rural corridors and a county mostly does not. It reverses entirely on highways, where trucks are 13.1% of traffic and the busiest highway states are the freight-corridor ones.
One county breaks the pattern hard. San Bernardino County runs 11.5% trucks overall and 15.9% on its highways, 1.35 times the next-highest county in the table and well above the national figure. It sits in California, whose statewide truck share is only 7.8%.
San Bernardino is the Inland Empire, the warehouse belt that receives what comes through the Los Angeles and Long Beach ports and pushes it east on the interstates. Its neighbour Riverside County is second in the table on truck share at 8.5%, which is the same corridor. Anyone siting distribution space on a state-level truck figure for California would conclude the state is light on freight and would miss the two counties where all of it is happening.
The pattern that made the state ranking interesting repeats here. Dallas County is 8th by total travel while posting the lowest AADT in the top fifteen, 7,931 vehicles per day, barely above the national average of 6,986. Tarrant County next door is much the same at 8,475.
They are here because of network size. Dallas County carries its 64.5 million vehicle-miles across 4,874 road miles. Orange County, California carries 68.6 million, only 6% more, across 3,284 miles, a third less road, which is why its roads run at 15,435 vehicles per day and Dallas's do not.
Congestion follows the same split. Dallas County is the least congested county in this table at 16.9%, below the national average, while Los Angeles, San Diego and Cook County all sit above 30%. Two counties can carry near-identical amounts of driving and offer completely different journeys.
It is not per capita. Populous counties rank highly partly because they are populous. This answers where the most traffic is, not where people drive the most, which is a different question with a very different top fifteen.
County boundaries are not travel markets. Dallas and Tarrant are one metropolitan area split across two rows; the same is true of Riverside and San Bernardino. Merging either pair moves it straight to second place: Riverside plus San Bernardino carry 142.6 million vehicle-miles a day and Dallas plus Tarrant 110.5 million, both above Harris County's 107.1 million, and both still well short of Los Angeles. A ranking of metro areas would reorder everything below first place.
Truck share counts vehicles, not tonnage. It is a proxy for road freight activity on a county's own roads, not a measure of goods value, and it says nothing about what those trucks carry or where the load began.
Every county in the table has a full traffic profile with hourly and seasonal patterns, highway and local road splits, congestion, travel time and driver demographics. They are free and need no account. Start with Los Angeles, Harris or Maricopa, read the companion pieces on the top 10 states by traffic volume, the top 10 states by highway traffic volume the top 15 counties by highway traffic volume and peak traffic season by state, or open the national overview and work down to your own county.
Ranking places by "traffic" is ambiguous, because there are two honest answers and they disagree.
AADT, or annual average daily traffic, is how busy a typical road is: the average number of vehicles crossing a point on an average day. It tells you what it feels like to drive there.
VMT, or vehicle-miles travelled, is how much driving actually happens: every vehicle multiplied by every mile it covers, summed across the whole network. It tells you how much transport a place consumes.
A small dense county can have high AADT and modest VMT. A large county with a big network can have the reverse. This ranking uses daily VMT, because the question "which counties carry the most traffic" is really a question about total load on the network, and because VMT is what road wear, fuel demand and freight capacity actually scale with. AADT sits in the table alongside it, and the gap between the two columns is where everything above came from.
TrafficZoom is a transportation analytics platform built by Ticon, which has worked on transportation data since 2016. We are not a survey and we are not republishing a government table. We measure traffic directly, then check ourselves against the agencies that do it with hardware.
The short version of the method:
Every figure on this page is current as of Q3 2026 and matches the county pages linked in the table. The full write-up is on our methodology page.
Traffic volumes, truck share, congestion and travel time are measured by TrafficZoom from anonymized vehicle movement data, map-matched to an OpenStreetMap road network and calibrated against physical counting stations published by state departments of transportation and the US Department of Transportation. Driver age and income are derived from US Census Bureau American Community Survey five-year estimates joined to trip-origin block groups. Traffic figures are current as of Q3 2026. Full details are on the TrafficZoom methodology page.
Los Angeles County, California has the most traffic of any US county, carrying 204.5 million vehicle-miles of travel on an average day, or 2.69% of the national total. That is nearly twice the second-placed county, Harris County, Texas, and enough to rank 12th if Los Angeles County were counted as a state.
The 15 busiest US counties carry 14.4% of all daily vehicle-miles travelled, on just 5.5% of the country's road miles. They are 15 of 3,131 measured counties, and their roads average 12,916 vehicles per day against a national average of 6,986.
Six of the 15 busiest US counties are in California and four are in Texas, so two states supply ten of the fifteen. The six California counties together carry more daily travel than any state except California itself and Texas.
Of the 15 busiest US counties, San Bernardino County, California has the heaviest truck traffic: commercial vehicles are 11.5% of all its traffic and 15.9% on its highways. That is 1.35 times the next highest county, in a state whose overall truck share is only 7.8%.
Dallas County, Texas ranks 8th in the country for total travel while averaging 7,931 vehicles per day, the lowest of the 15 busiest counties. It carries 64.5 million vehicle-miles across 4,874 road miles, so the volume comes from the size of the network rather than from busy individual roads.
Yes, by a wide margin. The 15 busiest US counties average 12,916 vehicles per day on a typical road, 85% above the national average, while the 10 busiest states average 8,084, only 16% above it. Traffic concentrates far harder at county level than at state level.
Identify traffic patterns street by street and analyze the exact corridors that matter to your project.


