TrafficZoom Team
September 8, 2026
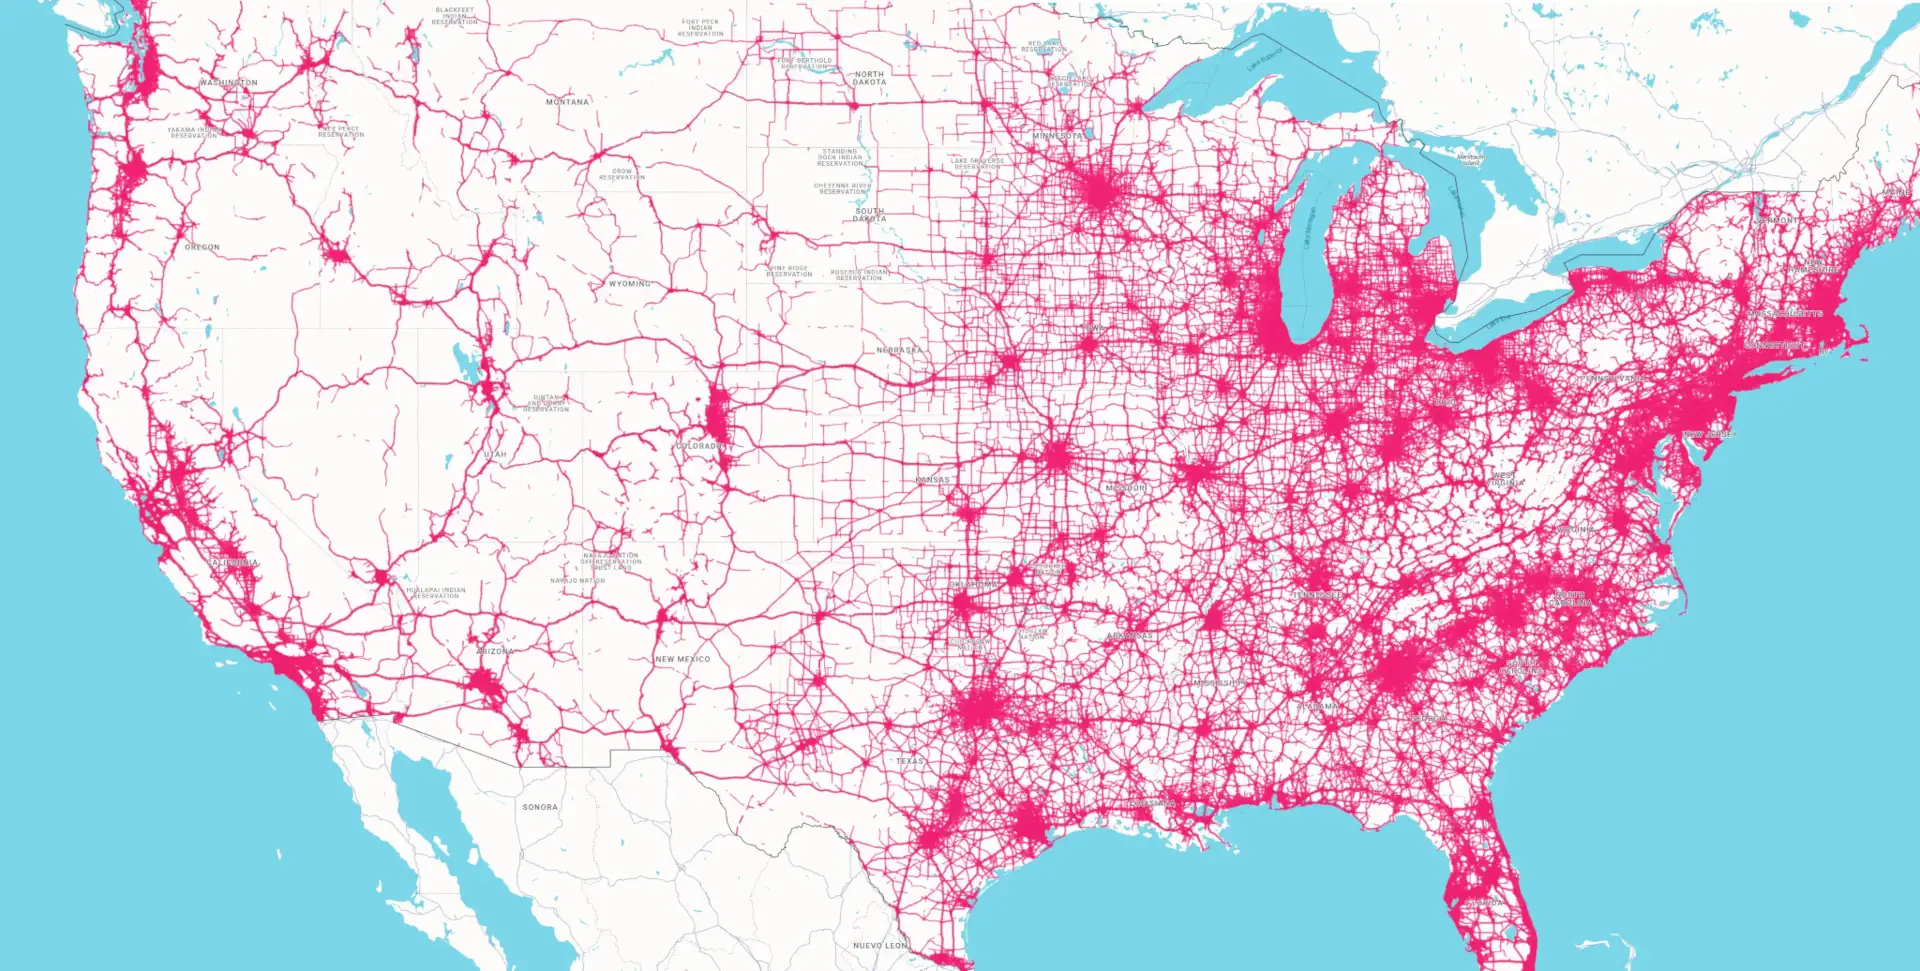
On an average day, 51.9% of all the driving in the United States happens inside ten state lines. Those same ten states hold 41.6% of the country's road.
That gap is the whole story of this ranking. We measure 1,223,095 centerline miles of US road across all 50 states and the District of Columbia, and when you sort states by how much travel they actually carry, the order stops matching the things people assume drive it. The state with the most road is not the state with the most traffic. Four of the ten busiest states have roads that are quieter than average. And the two states that move the most freight are separated by a margin thin enough to call a tie.
Daily vehicle-miles travelled is the network's total workload: every vehicle multiplied by every mile it covers. Average AADT answers a different question, which is how busy a typical road is. Watch those two columns disagree.
| # | State | Daily VMT (M) | Share of US | Avg AADT | Truck share | Road miles |
|---|---|---|---|---|---|---|
| 1 | California | 927.5 | 12.2% | 12,766 | 7.8% | 66,735 |
| 2 | Texas | 735.4 | 9.7% | 6,895 | 9.8% | 115,990 |
| 3 | Florida | 524.3 | 6.9% | 9,922 | 8.6% | 47,793 |
| 4 | Georgia | 279.6 | 3.7% | 7,398 | 9.7% | 45,061 |
| 5 | North Carolina | 273.2 | 3.6% | 6,332 | 8.7% | 39,529 |
| 6 | New York | 260.4 | 3.4% | 7,377 | 8.0% | 40,441 |
| 7 | Ohio | 259.8 | 3.4% | 5,773 | 9.9% | 47,102 |
| 8 | Illinois | 237.9 | 3.1% | 8,480 | 10.2% | 36,683 |
| 9 | Virginia | 221.9 | 2.9% | 5,349 | 9.6% | 34,958 |
| 10 | Michigan | 219.7 | 2.9% | 7,697 | 7.7% | 34,085 |
| Top 10 combined | 3,940.0 | 51.9% | 8,084 | 8.8% | 508,378 | |
| United States | 7,593.8 | 100% | 6,986 | 9.3% | 1,223,095 |
Truck share is the share of all traffic made up of commercial vehicles, across every road class. Road miles are true centerline miles, not lane-miles or directional miles. The combined row is recombined the same way our state and national roll-ups are: AADT weighted by segment count, truck share by vehicle-miles, road miles summed. Full national context sits on the United States traffic data page.
The concentration is steeper than most people expect. California alone accounts for 12.2% of all US road travel. Add Texas and Florida and three states are already carrying 28.8% of the national total. The tenth state, Michigan, pushes the running total past half at 51.9%. The remaining 41 states plus the District of Columbia divide the other 48.1% between them.
Across a year that top ten moves roughly 1.44 trillion vehicle-miles, out of about 2.77 trillion nationally.
Size alone does not explain it. Those ten states hold 41.6% of America's road miles but carry 51.9% of its travel, so their roads work harder: 8,084 vehicles per day on the average road against a national 6,986, a gap of 15.7%.
One number in the combined row runs the other way. Trucks are 8.8% of traffic across the top ten, below the national 9.3%. The states that carry the most driving are slightly less truck-intensive than the country as a whole, because what makes a state busy is mostly commuters. Freight intensity concentrates on the corridors between metros rather than inside them, which is a pattern that turns up again in Illinois further down.
This is also why national averages mislead so easily. A statement like "the average American road carries 6,986 vehicles per day" is arithmetically true and describes almost nobody's commute, because the distribution behind it is this lopsided.
Texas has more road than any other state, by a wide margin: 115,990 centerline miles, 1.74 times California's 66,735. And yet California carries 26% more daily travel.
The reconciliation is in the AADT column. California's average road carries 12,766 vehicles per day, 83% above the national average and 1.85 times what a Texas road carries. California is the only state that ranks first in the country on both total travel and average road busyness. It holds first place on all four measures we rank states by: total travel, average road busyness, highway travel and highway busyness. Texas ranks 2nd on travel and only 20th of 51 on AADT.
Two very different transport systems produce a similar-looking result. California concentrates enormous demand onto a comparatively compact network, which is also why it posts the worst congestion in the top ten at 27.4% against a national 18.9%. Texas spreads a similar amount of demand across almost twice as much pavement, and its congestion ratio, 16.4%, is one of the lowest of the ten.
You can see the same pattern one level down. Los Angeles County alone carries 204.5 million vehicle-miles a day, 22.1% of California's entire total, on roads averaging 19,000 vehicles per day. Texas's busiest county, Harris County, carries 107.1 million, 14.6% of its state. California's traffic has a centre of gravity; Texas's is more evenly distributed. The concentration gets far steeper below this: fifteen counties carry 14.4% of all US travel on 5.5% of the road.
This is the finding that changed how we read the table. Four of the ten busiest states in America have roads that are below the national average for daily traffic:
They are on this list because of network size, not road intensity. Ohio has the fourth-largest road network in the country at 47,102 miles. Virginia is the sharpest case of all: 9th in the nation for total travel while ranking 35th of 51 for how busy a typical road is. Virginia also has one of the shortest average journey times in the country, 31.7 minutes against a national 33.3, placing it 47th of 51 states by travel time.
A driver in Virginia experiences quiet roads and short trips. The state as a whole is nonetheless one of the ten heaviest transport consumers in America. Both things are true at once, and a single "traffic" ranking that reported only one of them would be misleading either way. It is the practical reason our county and state pages publish AADT, VMT and travel time side by side rather than collapsing them into one score.
Multiply each state's total travel by its truck share and you get daily truck-miles, which is the number that matters for freight planning, pavement design and warehouse siting.
California: 72.07 million daily truck-miles. Texas: 71.85 million. That is a gap of 0.3%, effectively a dead heat, even though California moves 26% more total traffic.
The reason is that the two states are opposites on truck intensity. Trucks are 9.8% of all Texas traffic and only 7.8% of California's. California ends up first in the country for the raw number of trucks on its highways while ranking 39th of 51 for highway truck share. It is a passenger-traffic state that happens to be so large it also leads on freight volume. Texas is a genuine freight state.
This is a good example of why share and volume have to be read together. Restrict the same question to highways and the ranking itself changes: two states enter the top ten and two leave, as the highway traffic ranking shows. A logistics analyst asking "where is the freight" and a pavement engineer asking "what proportion of my load is heavy vehicles" are asking different questions, and California answers them very differently.
Illinois is 8th on this list, the smallest road network in the top ten at 36,683 miles. But on highway truck share it is 5th in the entire country at 17.3%, a third above the national highway figure of 13.1% and the highest of any state in this top ten.
The intuitive explanation is Chicago. The data says otherwise. Cook County, which contains Chicago and carries 26.8% of the state's total travel, posts a highway truck share of just 11.0%, well below the Illinois average and below the national figure.
Illinois is freight-heavy because of what runs through it rather than what happens inside its largest city. The interstate corridors crossing the state outside Cook County are doing the work. Metropolitan road traffic is dominated by commuters; the long-haul freight is on the corridors between metros. Anyone siting a distribution centre on the strength of a state-level truck figure would be looking in the wrong county.
Three limits worth stating plainly.
It is an annual average. Every figure here is a full-year number, and traffic is not flat across the year: nationally it runs about 15% higher in June than in January, and in some states the gap is four times that. Peak traffic season by state breaks the same network down month by month.
It is not a per-capita or per-driver measure. Large states rank highly partly because they are large. This ranking answers "where is the most traffic", not "where do people drive the most", which is a different question with a different top ten.
Truck share is a share of vehicles, not of tonnage or value. A state can move a great deal of freight economic value in relatively few heavy vehicles, or a lot of light commercial traffic that is not long-haul freight at all. Truck-miles are a proxy for road freight activity, not a substitute for tonnage data.
Driver age and income come from a different source with a different vintage. Those figures are Census ACS five-year estimates joined to trip origins, so they describe the neighbourhoods trips start in, and their five-year window smooths short-term change. Traffic volumes are measured directly and are current as of Q3 2026. We do not mix the two vintages in a single claim, and neither should anyone quoting this page.
One thing this ranking is genuinely good for: it is a stable, national, like-for-like comparison. Every state in the table was measured with the same method on the same network at the same time, which is exactly what makes state DOT figures difficult to compare against each other.
Every state in the table has a full traffic profile with hourly and seasonal patterns, highway and local road splits, congestion, travel time and driver demographics, plus a ranked breakdown of its own counties. They are free and need no account. Start with California, Texas or Florida, read the companion pieces on the top 15 counties by traffic volume, the top 10 states by highway traffic volume the top 15 counties by highway traffic volume and peak traffic season by state, or open the national overview and work down to your own county.
Ranking states by "traffic" is ambiguous, because there are two honest answers and they disagree.
AADT, or annual average daily traffic, is how busy a typical road is: the average number of vehicles crossing a point on an average day. It tells you what it feels like to drive there.
VMT, or vehicle-miles travelled, is how much driving actually happens: every vehicle multiplied by every mile it covers, summed across the whole network. It tells you how much transport a state consumes.
A small dense state can have high AADT and low VMT. A large rural state can have the reverse. This ranking uses daily VMT, because the question "which states carry the most traffic" is really a question about total load on the network, and because VMT is what road wear, fuel demand and freight capacity actually scale with. AADT sits in the table alongside it, and the gap between the two columns is where everything above came from.
TrafficZoom is a transportation analytics platform built by Ticon, which has worked on transportation data since 2016. We are not a survey and we are not republishing a government table. We measure traffic directly, then check ourselves against the agencies that do it with hardware.
The short version of the method:
Every figure on this page is current as of Q3 2026 and matches the state pages linked in the table. The full write-up is on our methodology page.
Traffic volumes, truck share, congestion and travel time are measured by TrafficZoom from anonymized vehicle movement data, map-matched to an OpenStreetMap road network and calibrated against physical counting stations published by state departments of transportation and the US Department of Transportation. Driver age and income are derived from US Census Bureau American Community Survey five-year estimates joined to trip-origin block groups. Traffic figures are current as of Q3 2026. Full details are on the TrafficZoom methodology page.
California has the most traffic of any US state, carrying 927,539,301 vehicle-miles of travel on an average day, or 12.2% of the national total. It is also the only state that ranks first nationally on both total travel and average road busyness, at 12,766 vehicles per day on a typical road.
The ten busiest US states carry 51.9% of all daily vehicle-miles travelled on American roads, about 3.94 billion of the national 7.59 billion. The remaining 41 states and the District of Columbia share the other 48.1%, which makes national traffic averages a poor guide to any individual state.
Texas has far more road than California: 115,990 centerline miles against 66,735, a factor of 1.74. California still carries 26% more daily travel, because its average road handles 12,766 vehicles per day compared with 6,895 in Texas. Texas has the larger network; California has the busier one.
California has the highest average annual daily traffic in the United States at 12,766 vehicles per day, 83% above the national average of 6,986. It also posts the highest congestion ratio in the top ten at 27.4%, against a national figure of 18.9%, reflecting heavy demand on a comparatively compact network.
California and Texas are effectively tied on road freight, moving 72.07 million and 71.85 million daily truck-miles respectively, a gap of just 0.3%. Texas is the more truck-intensive state, with commercial vehicles making up 9.8% of its traffic against 7.8% in California.
No. Illinois ranks 5th nationally for highway truck share at 17.33%, but Cook County, which contains Chicago, posts only 11.02% on its highways, below the national 13.07%. Illinois is freight-heavy because of interstate corridors running through the state, not because of traffic inside its largest city.
Identify traffic patterns street by street and analyze the exact corridors that matter to your project.


