TrafficZoom Team
September 8, 2026
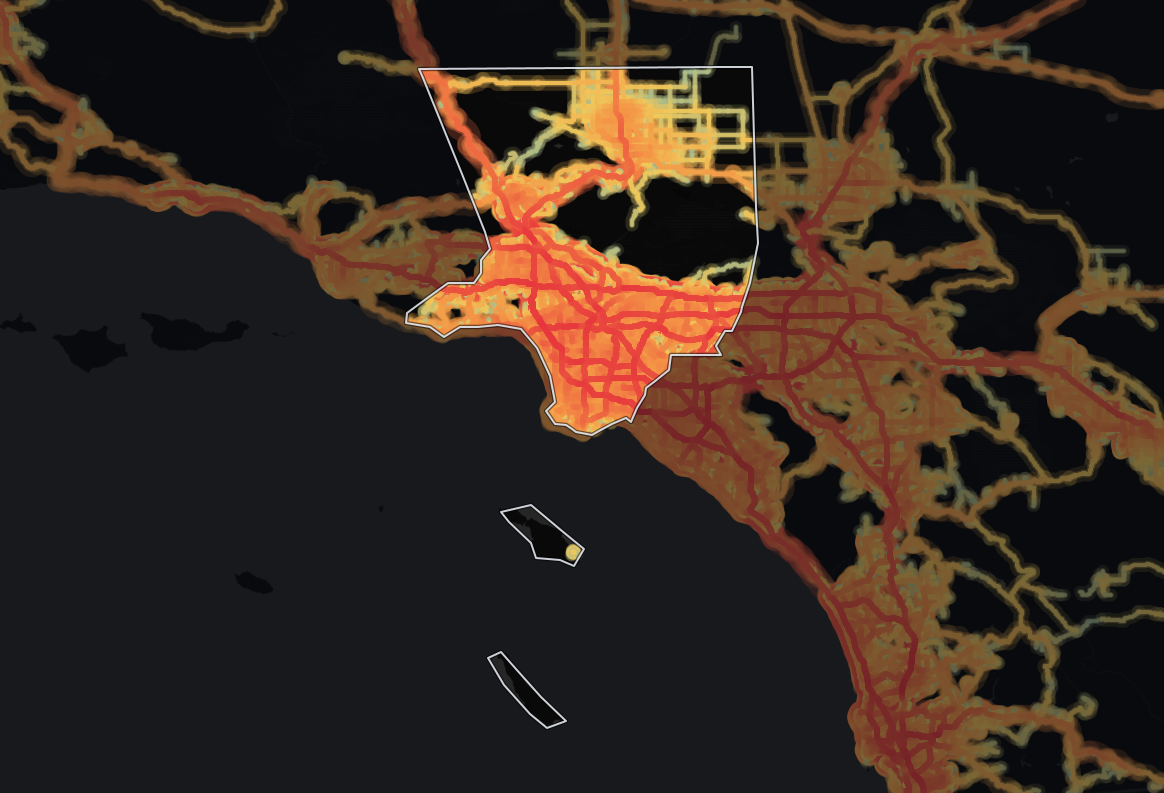
Fifteen counties carry 14.6% of all American highway travel on 4.6% of the country's highway miles. Their highways run at 46,345 vehicles per day, three times the national highway average.
Start with a fact that surprised us: 409 of the 3,131 counties we measure have no highway at all, 13.1% of them. Highway traffic is a far more concentrated thing than traffic in general, and ranking counties by it produces a different list, a different set of leaders, and one county that quietly explains a result we found at state level.
The ranking is by daily highway vehicle-miles travelled. The last column is the share of each county's own driving that happens on a highway, which separates a county that a highway passes through from a county that mostly drives on streets.
| # | County | Daily VMT (M) | Share of US highway | Highway AADT | Truck share | Highway miles | Share on highway |
|---|---|---|---|---|---|---|---|
| 1 | Los Angeles County, California | 102.3 | 2.67% | 71,593 | 7.4% | 1,346 | 50.0% |
| 2 | Harris County, Texas | 55.4 | 1.44% | 48,758 | 9.2% | 1,182 | 51.7% |
| 3 | San Diego County, California | 47.9 | 1.25% | 56,292 | 6.6% | 833 | 56.3% |
| 4 | Maricopa County, Arizona | 44.7 | 1.17% | 37,295 | 9.3% | 1,329 | 45.6% |
| 5 | San Bernardino County, California | 42.0 | 1.10% | 41,523 | 15.9% | 1,304 | 59.1% |
| 6 | Riverside County, California | 36.6 | 0.95% | 45,062 | 12.1% | 837 | 51.2% |
| 7 | Dallas County, Texas | 36.4 | 0.95% | 53,960 | 10.6% | 719 | 56.5% |
| 8 | Orange County, California | 32.1 | 0.84% | 62,949 | 6.2% | 509 | 46.8% |
| 9 | Tarrant County, Texas | 25.3 | 0.66% | 40,954 | 9.6% | 628 | 55.0% |
| 10 | Santa Clara County, California | 25.1 | 0.65% | 43,126 | 6.4% | 466 | 59.7% |
| 11 | Cook County, Illinois | 24.2 | 0.63% | 39,126 | 11.0% | 585 | 37.9% |
| 12 | Alameda County, California | 23.7 | 0.62% | 60,841 | 7.9% | 327 | 64.8% |
| 13 | Bexar County, Texas | 23.5 | 0.61% | 29,911 | 9.9% | 656 | 55.9% |
| 14 | Miami-Dade County, Florida | 21.5 | 0.56% | 34,754 | 6.1% | 556 | 45.1% |
| 15 | Broward County, Florida | 21.1 | 0.55% | 27,800 | 6.7% | 647 | 54.6% |
| Top 15 combined | 561.9 | 14.6% | 46,345 | 9.0% | 11,923 | 51.7% | |
| United States | 3,836.2 | 100% | 15,210 | 13.1% | 261,076 | 50.5% |
Highway covers the trunk network, motorways through to primary routes, and excludes local and residential streets. Truck share is the proportion of highway traffic made up of commercial vehicles. Highway miles are true centerline miles. The combined row is recombined the way our state and national roll-ups are: AADT weighted by segment count, truck share by vehicle-miles, miles summed. National context sits on the United States traffic data page.
Los Angeles County runs its highways at 71,593 vehicles per day, 4.7 times the national highway average of 15,210. It carries 102.3 million highway vehicle-miles a day, 2.67% of the national total, on 1,346 highway miles.
Rank every county in the country by highway AADT and the top five are all Californian: Los Angeles at 71,593, Orange at 62,949, Alameda at 60,841, Sacramento at 57,030 and San Diego at 56,292. California supplies seven of the fifteen counties in the table, Texas four and Florida two.
This is the county-level shape of a state-level result. California's highways average 37,794 vehicles per day, the highest of any state, and the highway ranking by state shows it carrying 13.0% of all US highway travel. The counties above are where that number comes from.
The combined row holds a contrast worth pulling out. These fifteen counties run their highways at 46,345 vehicles per day, 3.05 times the national highway average, and at the same time carry 9.0% trucks against a national 13.1%. The busiest highways in the country are also among the least freight-intensive.
What makes this more than a restatement is how the gap changes with the level you look at. Measured against their own national average, the truck share of the fifteen busiest highway counties runs at 0.69 of it. For the fifteen busiest counties on all roads the ratio is 0.74. For the ten busiest highway states it is 0.96, which is barely a gap at all.
Commuter volume dilutes freight share, and the effect is a metropolitan-county phenomenon that almost disappears once you aggregate to a whole state. A state large enough to top the highway ranking contains its own rural freight corridors, which put the trucks back. A single urban county does not.
Of the fifteen counties here, Cook County puts the smallest share of its own driving on a highway: 37.9%, against 50.5% nationally and 51.7% across this group. It is 9th in the country on all roads and 11th on highways.
That single figure resolves something we flagged at state level. Illinois has the most truck-heavy highways of any state in either national top ten at 17.3%, yet ranks only 12th for highway travel and puts just 39.5% of its driving on highways. Cook County is 26.8% of Illinois's total travel, and it drives on streets. The state's freight moves on interstates that mostly run somewhere else.
The same reading works in reverse for Miami-Dade County, the biggest faller among the fifteen at 10th on all roads to 14th on highways. It sends 45.1% of its travel onto highways and posts the lowest highway truck share of the fifteen at 6.1%. Florida behaves the same way one level up, with the lowest highway share of the ten busiest highway states.
Alameda County is 19th in the country for total traffic and 12th for highway traffic, a gain of seven places, the largest move in either direction here. It sends 64.8% of all its driving onto highways, the highest share of the fifteen, across only 327 highway miles, the smallest highway network in the table.
A small, extremely heavily loaded trunk network is what that combination describes: 60,841 vehicles per day on the third-busiest county highways in the country. East Bay traffic is funnelled onto a short length of interstate to an unusual degree.
At the other end of the freight question, San Bernardino County posts a 15.9% highway truck share, the highest of the fifteen, above the national highway figure of 13.1% and above every state in the highway top ten. Its neighbour Riverside is second at 12.1%. The Inland Empire warehouse belt shows up on the highway numbers even more clearly than it does on the all-roads ones.
Switching from all roads to highways reorders the county table more than it reorders the state table, where the top seven did not move at all.
| County | All-roads rank | Highway rank | Move | Share on highway |
|---|---|---|---|---|
| Los Angeles County | 1 | 1 | same | 50.0% |
| Harris County | 2 | 2 | same | 51.7% |
| San Diego County | 4 | 3 | +1 | 56.3% |
| Maricopa County | 3 | 4 | -1 | 45.6% |
| San Bernardino County | 6 | 5 | +1 | 59.1% |
| Riverside County | 5 | 6 | -1 | 51.2% |
| Dallas County | 8 | 7 | +1 | 56.5% |
| Orange County, CA | 7 | 8 | -1 | 46.8% |
| Tarrant County | 11 | 9 | +2 | 55.0% |
| Santa Clara County | 12 | 10 | +2 | 59.7% |
| Cook County | 9 | 11 | -2 | 37.9% |
| Alameda County | 19 | 12 | +7 | 64.8% |
| Bexar County | 13 | 13 | same | 55.9% |
| Miami-Dade County | 10 | 14 | -4 | 45.1% |
| Broward County | 17 | 15 | +2 | 54.6% |
| King County | 14 | 16 | -2 | 49.6% |
| Clark County | 15 | 19 | -4 | 45.6% |
All-roads ranks come from the top 15 counties by traffic volume. Ranks are national, across 3,131 measured counties.
Only three counties hold the same position on both measures: Los Angeles, Harris and Bexar. Alameda and Broward enter the top fifteen, displacing King County, Washington and Clark County, Nevada, which fall to 16th and 19th.
The peculiar thing is how orderly the churn is. Every county that gains places has a high share of its travel on highways, and every county that loses places has a low one. Santa Clara gains two at 59.7%, Tarrant gains two at 55.0%, Dallas gains one at 56.5%; Cook drops two at 37.9%, Miami-Dade drops four at 45.1%, Clark drops four at 45.6%. There is no case in this table of a county gaining ground on the highway measure while running most of its traffic on streets, which is a good sanity check that the road-class split is doing what it claims.
Highway is a road-class definition, not a road-name one. It covers the trunk network by functional class, so it is not identical to the Interstate system and a county's highway mileage will not match an Interstate mileage table.
409 counties are absent by construction. Counties with no highway cannot appear, and they are 13.1% of those we measure. This is a ranking of highway traffic, not a ranking of counties.
County boundaries are not travel markets. Dallas and Tarrant are one metropolitan area in two rows, as are Riverside and San Bernardino. A metro-level ranking would merge them and reorder the table.
Truck share counts vehicles, not tonnage. It says how much of the traffic stream is commercial, not what is carried or how far.
Highway volumes are measured, not modelled. Anonymized vehicle movement data is map-matched onto individual road segments and scaled to full traffic using penetration ratios derived from nearby physical counting stations operated by state departments of transportation and the US Department of Transportation. Each segment takes a distance-weighted and road-class-weighted blend of the stations that actually observe it, which is what keeps the result at about 11.2% average error against those hardware counts.
The truck share is where our own deep neural network does the work. It is a feed-forward network, 128 to 64 to 32 to 8 units, trained on detector data and reading 42 inputs per segment across four families:
That last family is why the model can separate a warehouse corridor from a commuter corridor carrying identical volumes, and why the San Bernardino result above is a measurement rather than an assumption.
Every county in the table has a full traffic profile splitting highway from local roads, with hourly and seasonal patterns, congestion, travel time and driver demographics. They are free and need no account. Start with Los Angeles, Cook or Alameda, read the companion pieces on the top 15 counties by total traffic volume, the top 10 states by highway traffic volume the top 10 states by traffic volume and peak traffic season by state, or open the national overview.
TrafficZoom is a transportation analytics platform built by Ticon, which has worked on transportation data since 2016. We are not a survey and we are not republishing a government table. We measure traffic directly, then check ourselves against the agencies that do it with hardware.
The short version of the method:
Every figure on this page is current as of Q3 2026 and matches the county pages linked in the table. The full write-up is on our methodology page.
Traffic volumes, truck share, congestion and travel time are measured by TrafficZoom from anonymized vehicle movement data, map-matched to an OpenStreetMap road network and calibrated against physical counting stations published by state departments of transportation and the US Department of Transportation. Driver age and income are derived from US Census Bureau American Community Survey five-year estimates joined to trip-origin block groups. Traffic figures are current as of Q3 2026. Full details are on the TrafficZoom methodology page.
Los Angeles County, California has the busiest highways in the United States, averaging 71,593 vehicles per day, 4.7 times the national highway average of 15,210. It carries 102.3 million highway vehicle-miles daily, 2.67% of the national total, across 1,346 highway miles.
409 of the 3,131 counties TrafficZoom measures have no highway, 13.1% of them. Highway traffic is far more concentrated than traffic in general: the 15 busiest counties carry 14.6% of all US highway travel on just 4.6% of the country's highway miles.
The five counties with the highest highway AADT are all in California: Los Angeles at 71,593 vehicles per day, Orange at 62,949, Alameda at 60,841, Sacramento at 57,030 and San Diego at 56,292. California supplies seven of the fifteen busiest highway counties overall.
Cook County explains it. Cook is 26.8% of Illinois's total travel but puts only 37.9% of its driving on highways, against 50.5% nationally. Illinois has the most truck-heavy highways of any state in either national top ten at 17.3%, yet its own traffic is mostly on Chicago's streets.
Of the 15 busiest highway counties, San Bernardino County, California has the heaviest highway truck traffic at 15.9%, above the national highway figure of 13.1% and above every state in the highway top ten. Neighbouring Riverside County is second at 12.1%, the same Inland Empire freight corridor.
Yes, more than it does for states. Only Los Angeles, Harris and Bexar hold the same national rank on both measures. Alameda County gains seven places, from 19th on all roads to 12th on highways, while Miami-Dade falls four and King and Clark counties drop out of the top fifteen entirely.
Identify traffic patterns street by street and analyze the exact corridors that matter to your project.


