TrafficZoom Team
September 8, 2026
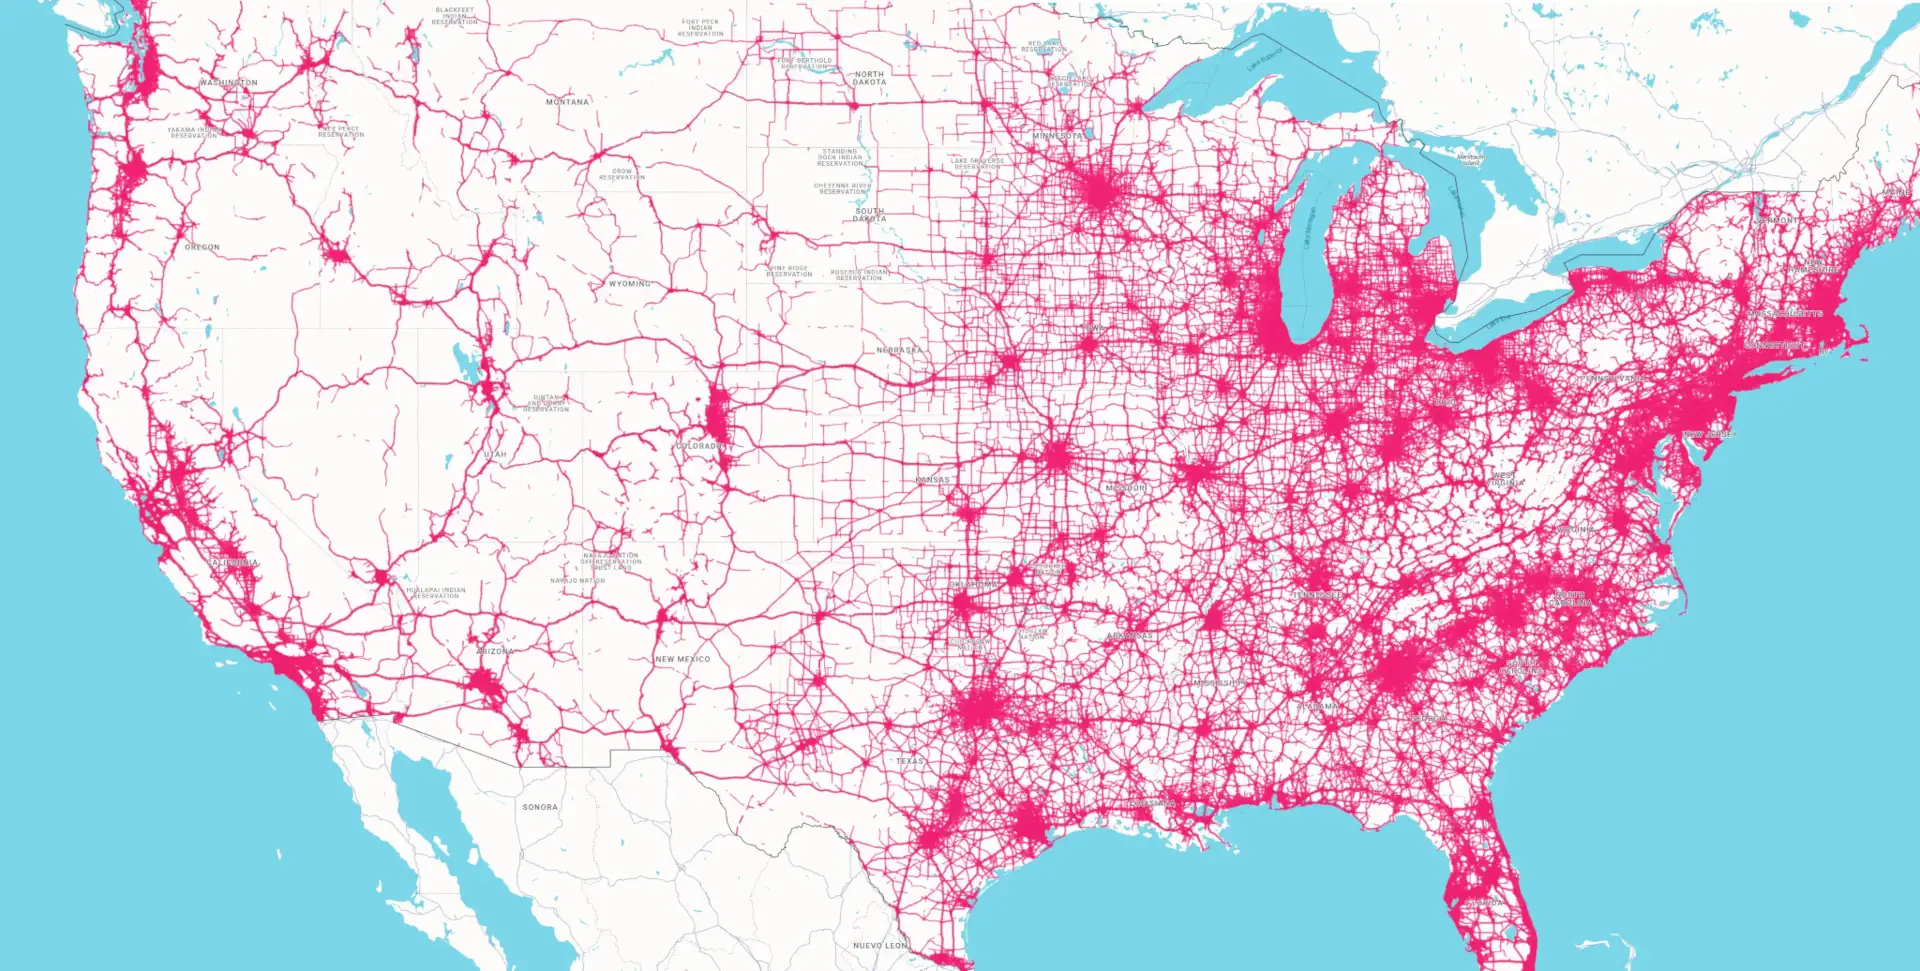
Traffic on an American road is about 15% busier in June than in January. Where you are decides whether that swing is 4 points or 63.
Anyone who sets staffing from a footfall estimate, signs a lease on an annual average, or plans a delivery network around a single traffic number is working with a figure that is wrong for most of the year. We measured the daily traffic curve for all 50 states and the District of Columbia across a full year, and the shape of that curve turns out to differ more between states than the traffic volume itself does.
Set the whole country's annual average traffic to 100 and the year runs like this: January 91, February 95, March 98, April 101, May 104, June 106, July 103, August 104, September 102, October 102, November 98, December 95.
June is the national peak and January the national floor, a spread of 15 points. That is the curve most people picture, and 39 of the 51 places we measured broadly follow it. The interesting part is the twelve that do not.
Pick a state to see its own twelve months. Each bar is that month's traffic against the state's annual average, so 100 is a normal month for that state and the bars are comparable across states even though the traffic volumes are not.
Jun is the busiest month at +5% versus this state's annual average, Jan the quietest at -8%. Spread 12 points. Full Alabama traffic profile.
Aug is the busiest month at +23% versus this state's annual average, Nov the quietest at -19%. Spread 41 points. Full Alaska traffic profile.
Mar is the busiest month at +8% versus this state's annual average, Jul the quietest at -7%. Spread 16 points. Full Arizona traffic profile.
May is the busiest month at +10% versus this state's annual average, Dec the quietest at -13%. Spread 22 points. Full Arkansas traffic profile.
Jun is the busiest month at +5% versus this state's annual average, Jan the quietest at -8%. Spread 13 points. Full California traffic profile.
Jul is the busiest month at +10% versus this state's annual average, Jan the quietest at -15%. Spread 25 points. Full Colorado traffic profile.
Jun is the busiest month at +8% versus this state's annual average, Jan the quietest at -9%. Spread 17 points. Full Connecticut traffic profile.
Aug is the busiest month at +15% versus this state's annual average, Jan the quietest at -14%. Spread 28 points. Full Delaware traffic profile.
Jun is the busiest month at +4% versus this state's annual average, Jan the quietest at -9%. Spread 13 points. Full District of Columbia traffic profile.
Mar is the busiest month at +5% versus this state's annual average, Aug the quietest at -4%. Spread 9 points. Full Florida traffic profile.
May is the busiest month at +3% versus this state's annual average, Jan the quietest at -6%. Spread 9 points. Full Georgia traffic profile.
May is the busiest month at +2% versus this state's annual average, Nov the quietest at -2%. Spread 4 points. Full Hawaii traffic profile.
Aug is the busiest month at +12% versus this state's annual average, Jan the quietest at -16%. Spread 28 points. Full Idaho traffic profile.
Jun is the busiest month at +7% versus this state's annual average, Jan the quietest at -10%. Spread 16 points. Full Illinois traffic profile.
Jun is the busiest month at +6% versus this state's annual average, Jan the quietest at -12%. Spread 18 points. Full Indiana traffic profile.
Jun is the busiest month at +9% versus this state's annual average, Jan the quietest at -15%. Spread 24 points. Full Iowa traffic profile.
May is the busiest month at +6% versus this state's annual average, Jan the quietest at -9%. Spread 16 points. Full Kansas traffic profile.
May is the busiest month at +4% versus this state's annual average, Jan the quietest at -9%. Spread 13 points. Full Kentucky traffic profile.
Mar is the busiest month at +5% versus this state's annual average, Jan the quietest at -5%. Spread 10 points. Full Louisiana traffic profile.
Aug is the busiest month at +21% versus this state's annual average, Jan the quietest at -21%. Spread 43 points. Full Maine traffic profile.
Oct is the busiest month at +6% versus this state's annual average, Jan the quietest at -10%. Spread 16 points. Full Maryland traffic profile.
Aug is the busiest month at +11% versus this state's annual average, Jan the quietest at -14%. Spread 24 points. Full Massachusetts traffic profile.
Jun is the busiest month at +9% versus this state's annual average, Jan the quietest at -11%. Spread 20 points. Full Michigan traffic profile.
Jun is the busiest month at +12% versus this state's annual average, Jan the quietest at -14%. Spread 26 points. Full Minnesota traffic profile.
Jun is the busiest month at +5% versus this state's annual average, Jan the quietest at -9%. Spread 14 points. Full Mississippi traffic profile.
Jun is the busiest month at +6% versus this state's annual average, Jan the quietest at -12%. Spread 18 points. Full Missouri traffic profile.
Jul is the busiest month at +33% versus this state's annual average, Jan the quietest at -25%. Spread 58 points. Full Montana traffic profile.
Sep is the busiest month at +9% versus this state's annual average, Jan the quietest at -16%. Spread 26 points. Full Nebraska traffic profile.
Jun is the busiest month at +8% versus this state's annual average, Jan the quietest at -9%. Spread 17 points. Full Nevada traffic profile.
Aug is the busiest month at +16% versus this state's annual average, Jan the quietest at -16%. Spread 32 points. Full New Hampshire traffic profile.
Jun is the busiest month at +8% versus this state's annual average, Jan the quietest at -9%. Spread 17 points. Full New Jersey traffic profile.
May is the busiest month at +4% versus this state's annual average, Jan the quietest at -8%. Spread 11 points. Full New Mexico traffic profile.
Aug is the busiest month at +11% versus this state's annual average, Jan the quietest at -13%. Spread 24 points. Full New York traffic profile.
Jun is the busiest month at +6% versus this state's annual average, Jan the quietest at -11%. Spread 17 points. Full North Carolina traffic profile.
Aug is the busiest month at +19% versus this state's annual average, Dec the quietest at -15%. Spread 34 points. Full North Dakota traffic profile.
Aug is the busiest month at +7% versus this state's annual average, Jan the quietest at -13%. Spread 20 points. Full Ohio traffic profile.
Jun is the busiest month at +5% versus this state's annual average, Jan the quietest at -9%. Spread 13 points. Full Oklahoma traffic profile.
Jun is the busiest month at +17% versus this state's annual average, Feb the quietest at -15%. Spread 32 points. Full Oregon traffic profile.
May is the busiest month at +7% versus this state's annual average, Jan the quietest at -10%. Spread 18 points. Full Pennsylvania traffic profile.
Aug is the busiest month at +12% versus this state's annual average, Jan the quietest at -12%. Spread 24 points. Full Rhode Island traffic profile.
Jun is the busiest month at +5% versus this state's annual average, Jan the quietest at -9%. Spread 14 points. Full South Carolina traffic profile.
Jun is the busiest month at +19% versus this state's annual average, Jan the quietest at -21%. Spread 40 points. Full South Dakota traffic profile.
May is the busiest month at +4% versus this state's annual average, Jan the quietest at -7%. Spread 11 points. Full Tennessee traffic profile.
Jun is the busiest month at +3% versus this state's annual average, Jan the quietest at -8%. Spread 11 points. Full Texas traffic profile.
Aug is the busiest month at +7% versus this state's annual average, Jan the quietest at -10%. Spread 18 points. Full Utah traffic profile.
Aug is the busiest month at +9% versus this state's annual average, Apr the quietest at -10%. Spread 19 points. Full Vermont traffic profile.
Jun is the busiest month at +6% versus this state's annual average, Jan the quietest at -10%. Spread 16 points. Full Virginia traffic profile.
Jul is the busiest month at +9% versus this state's annual average, Jan the quietest at -10%. Spread 19 points. Full Washington traffic profile.
Jun is the busiest month at +6% versus this state's annual average, Jan the quietest at -12%. Spread 17 points. Full West Virginia traffic profile.
Jun is the busiest month at +11% versus this state's annual average, Jan the quietest at -13%. Spread 24 points. Full Wisconsin traffic profile.
Jul is the busiest month at +34% versus this state's annual average, Jan the quietest at -29%. Spread 63 points. Full Wyoming traffic profile.
Assign each state to the season with its highest average traffic and the result is lopsided in a way we did not expect:
June to August
March to May
December to February
Not one state in the country runs its busiest traffic in winter. Thirty-nine peak in summer, eleven in spring and exactly one in autumn.
The eleven spring states are almost a map of the American South plus the desert: Arizona, Arkansas, Florida, Georgia, Louisiana, Oklahoma, South Carolina, Tennessee, Kansas, Hawaii and the District of Columbia. In hot states the peak arrives before the heat does. In the rest of the country it arrives with the holidays.
Maryland is the only autumn state in the union, peaking in October at 106. It is a genuine edge case rather than a strong pattern: its autumn index of 104.6 beats its summer index of 103.3 by barely a point.
The same 51 states again, this time placed in the month that is actually their busiest. Read it clockwise from January in the top-left corner.
The empty cells are the point. January, February, April, November and December are the busiest month for not one state in the country, so five of the twelve months are nobody's peak. Every state in the union reaches its annual high in one of just seven months, and 34 of the 51 do it in either June or August.
The mirror image is just as tight. Five months are nobody's quietest month either: March, May, June, September and October. Peaks live in the warm half of the year and troughs live in the cold half, and almost nothing crosses over. The two months that manage to be both somebody's peak and somebody's trough are July and August, and that is entirely down to Arizona and Florida.
If the peak varies, the trough mostly does not. 43 of 51 states record their quietest month in January. Only eight break the rule, and each break is informative:
For a business, the January floor is the practical headline. A location's annual-average traffic figure will overstate January by roughly the same margin nearly everywhere, and the size of that margin is the number worth knowing before committing to a lease or a January staffing plan.
Arizona and Florida are the only states whose quietest month falls in summer, and Arizona inverts the national pattern at both ends.
Arizona peaks in March at 108 and bottoms in July at 93, a 16-point swing in the opposite direction to the country. Florida is milder but the same shape: March 105, August 96. Both are heat-driven and both are seasonal-population states. Traffic arrives with the winter visitors and leaves when the temperature makes the place unpleasant.
The commercial implication is direct and easy to get wrong. A national retailer applying a summer-peak staffing template to a Phoenix or Tampa location is scheduling its heaviest coverage for the two months when the fewest vehicles pass the door.
The gap between a state's busiest and quietest month is where the practical money sits, and it ranges from almost nothing to enormous.
Wyoming runs 134 in July and 71 in January, a spread of 63 points. Traffic on a Wyoming road in high summer is close to double what it is in deep winter. Montana is nearly as extreme at 58 points, then Maine at 43 and Alaska at 41.
At the other end, Hawaii moves 3.6 points across the entire year. Its busiest month is 102 and its quietest 98. Florida at 8.7, Georgia at 9.4 and Louisiana at 9.7 are nearly as flat. The median state sits at 18 points.
So an annual average describes a Hawaii location almost perfectly and a Wyoming location almost never. The same words, "average daily traffic", carry completely different amounts of information depending on which state the sign is in. Low-amplitude states are the ones where a single annual figure is a sound basis for a decision; high-amplitude states need a month, or a season, attached.
Vermont is the one place in the country where every winter month sits at or above the annual average: December 101, January 100, February 100. It is the only state with a winter index above 100.
Its quietest month is April, at 90. Vermont is the only state in the dataset whose low point is in spring.
That is a ski economy showing up in road data. Winter traffic holds because the winter season is the season, and the trough lands in the gap between the last of the snow and the start of summer, which Vermonters call mud season. It is the clearest example in this dataset of a local economy, rather than a climate, setting the shape of the year.
Three practical readings.
Check the amplitude before you trust an annual average. In a single-digit-spread state the annual figure is close to every month. In a 40-point-spread state it is close to no month at all. The spread is the first thing to look up, ahead of the volume itself.
Match the template to the state, not the chain. The summer-peak assumption holds in 39 states and fails in twelve, two of them backwards. A national staffing or inventory model applied uniformly will be most wrong in exactly the markets where seasonality is strongest.
Use January as the stress test. Because 43 states bottom out in the same month, January traffic is the closest thing to a nationwide worst case. If a location works on its January number, it works all year.
It is one year. These curves come from 2023 daily traffic. A single year captures the shape of a normal year but cannot separate a durable seasonal pattern from a one-off, and an unusual weather year would show up here as if it were structural.
Seasons are calendar seasons. We assigned months to meteorological seasons, so a state peaking in late May and one peaking in early June land in different buckets despite being three weeks apart. Maryland's autumn label is exactly this kind of near-tie.
State averages hide local extremes. A state figure blends a beach county with a commuter county, and they can run opposite years. County-level curves are on each county page, and the spread within a state is often wider than the spread between states.
A note on our own high-season figure. The "busy season" shown on TrafficZoom county and state pages is the best contiguous three-month window, searched from January to October, so it cannot report a season that wraps across the new year. We checked whether that limit hides anything here: no state peaks in winter, so it does not affect any result on this page. The monthly figures above are computed directly from the daily curve and have no such constraint.
Traffic volumes are measured, not modelled. Anonymized vehicle movement data is map-matched onto individual road segments and scaled to full traffic using penetration ratios derived from physical counting stations operated by state departments of transportation and the US Department of Transportation, which holds the result at about 11.2% average error against those hardware counts.
The seasonal curves here are daily traffic for calendar year 2023, aggregated to state level and expressed as an index against each state's own annual mean, so a state's shape can be compared with another state's without the volume difference getting in the way. Months are calendar months and seasons are meteorological: winter is December to February, spring March to May, summer June to August, autumn September to November.
Every state and county page carries its own busy season, quietest month, weekday peak hours and weekend pattern, alongside volume, truck share, congestion and driver demographics. They are free and need no account. Look up Wyoming, Florida or your own county, read the companion pieces on the top 10 states by traffic volume, the top 15 counties by traffic volume, the top 10 states by highway traffic volume and the top 15 counties by highway traffic volume, or open the national overview.
TrafficZoom is a transportation analytics platform built by Ticon, which has worked on transportation data since 2016. We are not a survey and we are not republishing a government table. We measure traffic directly, then check ourselves against the agencies that do it with hardware.
The short version of the method:
Every figure on this page is current as of Q3 2026 and matches the state pages linked throughout. The full write-up is on our methodology page.
Traffic volumes, truck share, congestion and travel time are measured by TrafficZoom from anonymized vehicle movement data, map-matched to an OpenStreetMap road network and calibrated against physical counting stations published by state departments of transportation and the US Department of Transportation. Driver age and income are derived from US Census Bureau American Community Survey five-year estimates joined to trip-origin block groups. Traffic figures are current as of Q3 2026. Full details are on the TrafficZoom methodology page.
June is the busiest month on American roads, running about 6% above the annual average, while January is the quietest at roughly 9% below. That is a 15-point spread nationally, though individual states range from a 4-point swing in Hawaii to 63 points in Wyoming.
Wyoming has the most seasonal traffic of any US state. Its roads run at 134 in July against 71 in January, where 100 is Wyoming's annual average, a spread of 63 points. Montana is second at 58 points, then Maine at 43 and Alaska at 41.
Eleven states peak in spring: Arizona, Arkansas, Florida, Georgia, Kansas, Louisiana, Oklahoma, South Carolina, Tennessee, Hawaii and the District of Columbia. They are mostly southern or desert states, where traffic peaks before the summer heat arrives rather than with it.
Only Arizona and Florida. Arizona peaks in March at 108 and bottoms in July at 93, inverting the national pattern at both ends, and Florida peaks in March at 105 and bottoms in August at 96. Both are heat-driven, seasonal-population states whose visitors arrive in winter.
January, in 43 of the 51 states and the District of Columbia. The eight exceptions are Arizona in July, Florida in August, Arkansas and North Dakota in December, Alaska and Hawaii in November, Oregon in February and Vermont in April.
No state peaks in winter. Thirty-nine peak in summer, eleven in spring and one, Maryland, in autumn. Vermont comes closest: it is the only state whose winter months all sit at or above its annual average, and its quietest month is April rather than mid-winter.
Identify traffic patterns street by street and analyze the exact corridors that matter to your project.


