TrafficZoom Team
September 8, 2026
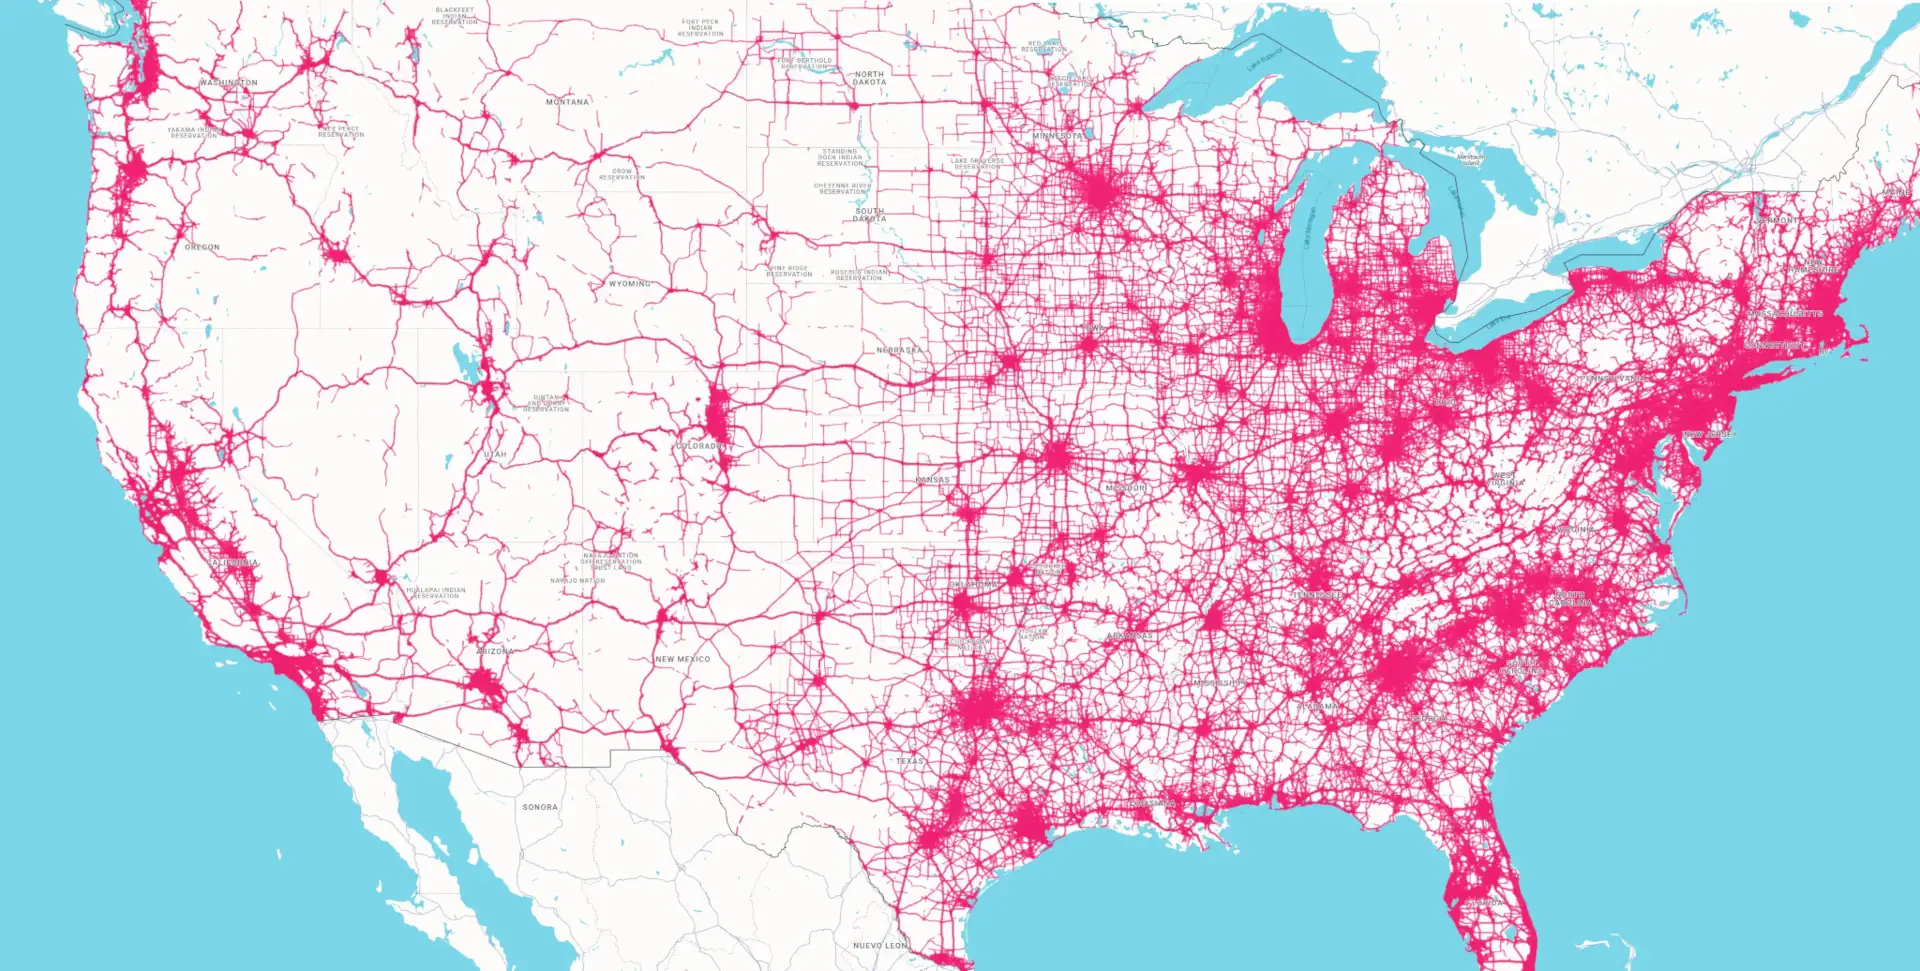
American highways are 21.3% of the country's road miles and carry 50.5% of its driving. Half the nation's travel happens on a fifth of its pavement.
That makes highway volume worth ranking on its own rather than folding into a total. Two states enter the top ten when you do, and two drop out, and the reason they swap is the single most useful thing in this data.
The ranking is by daily highway vehicle-miles travelled. The last column is the share of each state's own driving that happens on a highway, which is the number that separates a state with a lot of traffic from a state that funnels its traffic onto trunk roads.
| # | State | Daily VMT (M) | Share of US highway | Highway AADT | Truck share | Highway miles | Share on highway |
|---|---|---|---|---|---|---|---|
| 1 | California | 498.0 | 12.98% | 37,794 | 10.4% | 14,127 | 53.7% |
| 2 | Texas | 378.7 | 9.87% | 16,447 | 13.8% | 24,663 | 51.5% |
| 3 | Florida | 228.1 | 5.95% | 23,020 | 11.3% | 9,295 | 43.5% |
| 4 | Georgia | 145.8 | 3.80% | 14,649 | 13.6% | 9,296 | 52.1% |
| 5 | North Carolina | 142.9 | 3.73% | 14,850 | 12.1% | 9,419 | 52.3% |
| 6 | New York | 130.0 | 3.39% | 15,648 | 10.3% | 7,863 | 49.9% |
| 7 | Ohio | 128.7 | 3.36% | 14,665 | 14.9% | 7,967 | 49.5% |
| 8 | Virginia | 124.5 | 3.25% | 13,544 | 13.1% | 7,946 | 56.1% |
| 9 | Pennsylvania | 106.7 | 2.78% | 13,683 | 15.8% | 8,237 | 48.6% |
| 10 | Tennessee | 101.6 | 2.65% | 13,802 | 15.6% | 6,772 | 56.4% |
| Top 10 combined | 1,985.1 | 51.7% | 17,932 | 12.5% | 105,585 | 51.1% | |
| United States | 3,836.2 | 100% | 15,210 | 13.1% | 261,076 | 50.5% |
Highway covers the trunk network, motorways through to primary routes, and excludes local and residential streets. Truck share is the proportion of highway traffic made up of commercial vehicles. Highway miles are true centerline miles. The combined row is recombined the way our state and national roll-ups are: AADT weighted by segment count, truck share by vehicle-miles, miles summed. National context sits on the United States traffic data page.
The national split is stark. Highways account for 261,076 of 1,223,095 centerline miles, and 3.84 billion of the 7.59 billion vehicle-miles driven each day. The average highway carries 15,210 vehicles per day against 6,361 on everything else, a factor of 2.4.
They also work far closer to their limit. The national highway congestion ratio is 39.5%, against 18.9% across all roads. And they carry the freight: trucks are 13.1% of highway traffic and 5.6% of non-highway traffic.
The concentration repeats inside the ranking. These ten states hold 40.4% of America's highway miles and carry 51.7% of its highway travel.
Compared with the ranking by total traffic, the highway table swaps two entries. Pennsylvania (11th on total travel) and Tennessee (12th) move into the top ten, displacing Illinois and Michigan, which fall to 12th and 13th on highways.
The truck column explains it. Pennsylvania and Tennessee post the two highest highway truck shares in the table, 15.8% and 15.6%, against a national highway figure of 13.1%. Ohio is third at 14.9%. The states that appear when you switch from all roads to highways are freight-corridor states, and the states they displace are metropolitan ones.
Tennessee makes the case most clearly: 56.4% of all its driving happens on a highway, the highest share in the table, on the smallest highway network of the ten at 6,772 miles. Its traffic is disproportionately long-distance movement passing through on I-40, I-24 and I-75 rather than local circulation. Illinois, by contrast, is a top-ten state on total travel whose volume is concentrated in and around Chicago, which is a different kind of traffic entirely and is taken apart in the comparison below and, county by county, in the highway ranking for counties.
California alone accounts for 13.0% of all US highway travel, and its highways run at 37,794 vehicles per day, 2.5 times the national highway average and more than double any other state in the table except Florida.
Texas is the opposite build. It has 1.75 times California's highway mileage, 24,663 miles against 14,127, and carries 24% less highway travel across it, at 16,447 vehicles per day. The same contrast shows up in the totals, but it is sharper here: a state can build a very large trunk network without ever concentrating traffic the way California does.
California and New York also post the two lowest highway truck shares in the top ten, 10.4% and 10.3%. That is not a coincidence of two states. Across these ten, the busier a state's highways are, the smaller the share of trucks on them: the correlation between highway AADT and highway truck share is -0.61, and it holds at -0.51 across all 51 states, so it is not an artefact of a short list.
The mechanism is straightforward. Freight volume is set by what a corridor connects, while passenger volume is set by how many people live beside it, and the second scales much faster. A busy highway is usually a commuter highway with the same freight on it as a quiet one. This is a cross-sectional relationship between states at one point in time, not a claim that adding traffic to a highway pushes trucks off it.
Florida is 3rd for highway travel and has the second-busiest highways in the table at 23,020 vehicles per day, yet only 43.5% of its driving happens on a highway, the lowest share of the ten and well below the national 50.5%.
Florida runs an unusually large share of its traffic on arterials and local roads. A planner reading only the highway column would see an intensely loaded trunk network; reading only the share column would see a state whose travel is mostly off-highway. Both are true, and each is misleading alone.
Putting the all-roads table next to the highway one shows how little moves, and then how sharply the little that moves does move.
| State | All-roads rank | Highway rank | Move | Share on highway | Highway truck share |
|---|---|---|---|---|---|
| California | 1 | 1 | same | 53.7% | 10.4% |
| Texas | 2 | 2 | same | 51.5% | 13.8% |
| Florida | 3 | 3 | same | 43.5% | 11.3% |
| Georgia | 4 | 4 | same | 52.1% | 13.6% |
| North Carolina | 5 | 5 | same | 52.3% | 12.1% |
| New York | 6 | 6 | same | 49.9% | 10.3% |
| Ohio | 7 | 7 | same | 49.5% | 14.9% |
| Virginia | 9 | 8 | +1 | 56.1% | 13.1% |
| Pennsylvania | 11 | 9 | +2 | 48.6% | 15.8% |
| Tennessee | 12 | 10 | +2 | 56.4% | 15.6% |
| Illinois | 8 | 12 | -4 | 39.5% | 17.3% |
| Michigan | 10 | 13 | -3 | 42.6% | 12.0% |
All-roads ranks come from the top 10 states by traffic volume. Ranks are out of 51, counting the District of Columbia.
California, Texas, Florida, Georgia, North Carolina, New York and Ohio hold positions 1 through 7 in both rankings, in exactly the same order. Whatever road class you measure, the same seven states carry the most of it. That is a useful stability result: for most purposes the headline ranking of American traffic is not sensitive to how you define a highway.
All the movement is in the last three slots. Virginia gains one place, Pennsylvania two and Tennessee two, while Illinois drops four and Michigan three.
This is the peculiarity worth sitting with. Of the twelve states appearing in either top ten, Illinois has the highest highway truck share at 17.3%, fifth-highest in the country. It also has the lowest share of its own travel on highways, 39.5%, which is fourth-lowest of all 51 places, behind only the District of Columbia, Hawaii and Maine.
Both things are true at once, and together they say something specific: Illinois runs a nationally significant freight corridor and a very large metropolitan road network, and the second one is where its driving happens. That is exactly what we found a level down, where Cook County carries 26.8% of the state's travel at a highway truck share of only 11.0%. The freight is on the interstates crossing the state; the traffic is on Chicago's streets.
Look past the top ten and the sharpest case is Indiana. It is 15th on all roads and 21st on highways, a drop of six places, the largest fall of any state. And it has the third-highest highway truck share in the country at 19.6%.
Indiana is the same shape as Illinois, more extreme: intensely freight-loaded highways, only 45.0% of its travel on them. Freight intensity and highway dependence are different properties, and the two states that most obviously separate them sit next to each other on the map.
The reverse case is Kentucky, the biggest riser at 26th to 20th, which puts 60.8% of its driving on highways. And the national extreme is Wyoming: 66.2% of its travel on highways and a 23.3% highway truck share, both the highest in the United States, on a network that ranks only 42nd for highway volume. A state can be almost entirely a through-route and still barely register on a volume ranking.
Highway is a road-class definition, not a road-name one. It covers the trunk network by functional class, so it is not identical to the Interstate system, and a state's highway mileage here will not match an Interstate mileage table.
It is not per capita, and it is not lane-miles. Large states rank highly partly because they are large, and a six-lane highway and a two-lane one each count once in the mileage column.
Truck share counts vehicles, not tonnage. It says how much of the traffic stream is commercial, not what is being carried or how far.
Highway volumes are measured, not modelled. Anonymized vehicle movement data is map-matched onto individual road segments and scaled to full traffic using penetration ratios derived from nearby physical counting stations operated by state departments of transportation and the US Department of Transportation. Each segment takes a distance-weighted and road-class-weighted blend of the stations that actually observe it, which is what keeps the result at about 11.2% average error against those hardware counts.
The truck share is where our own deep neural network does the work. It is a feed-forward network, 128 to 64 to 32 to 8 units, trained on detector data and reading 42 inputs per segment across four families:
That last family is why the model can tell a warehouse corridor from a commuter corridor carrying identical volumes. It is also why the Pennsylvania and Tennessee result above is a finding rather than an assumption: nothing in the pipeline tells the model that those states are freight states.
Every state in the table has a full traffic profile splitting highway from local roads, with hourly and seasonal patterns, congestion, travel time and driver demographics. They are free and need no account. Start with California, Texas or Tennessee, read the companion pieces on the top 10 states by total traffic volume, the top 15 counties by traffic volume the top 15 counties by highway traffic volume and peak traffic season by state, or open the national overview.
TrafficZoom is a transportation analytics platform built by Ticon, which has worked on transportation data since 2016. We are not a survey and we are not republishing a government table. We measure traffic directly, then check ourselves against the agencies that do it with hardware.
The short version of the method:
Every figure on this page is current as of Q3 2026 and matches the state pages linked in the table. The full write-up is on our methodology page.
Traffic volumes, truck share, congestion and travel time are measured by TrafficZoom from anonymized vehicle movement data, map-matched to an OpenStreetMap road network and calibrated against physical counting stations published by state departments of transportation and the US Department of Transportation. Driver age and income are derived from US Census Bureau American Community Survey five-year estimates joined to trip-origin block groups. Traffic figures are current as of Q3 2026. Full details are on the TrafficZoom methodology page.
California has the most highway traffic of any US state, carrying 498.0 million highway vehicle-miles on an average day, or 13.0% of the national highway total. Its highways run at 37,794 vehicles per day, about 2.5 times the national highway average of 15,210.
Highways carry 50.5% of all US road travel on 21.3% of the country's centerline road miles. The average American highway handles 15,210 vehicles per day against 6,361 on all other roads, and highway congestion runs at 39.5% against 18.9% across the whole network.
Pennsylvania and Tennessee rank 11th and 12th for total US traffic but 9th and 10th for highway traffic, displacing Illinois and Michigan. They post the two highest highway truck shares in the top ten, 15.8% and 15.6% against a national 13.1%, because their volume is long-distance freight moving through on interstate corridors.
It varies enormously. Nationally 50.5% of US road travel is on highways, but Wyoming sends 66.2% of its driving onto them while the District of Columbia sends 25.4%. Among the busiest highway states, Tennessee is highest at 56.4% and Illinois lowest at 39.5%, which is why Illinois ranks 8th on all roads but only 12th on highways.
Yes, by more than double. Commercial vehicles are 13.1% of US highway traffic and 5.6% of traffic on non-highway roads. Among the busiest highway states the range runs from 15.8% in Pennsylvania down to 10.3% in New York, whose highway volume is dominated by commuting rather than freight.
Highway volumes are measured from anonymized vehicle movement data map-matched to individual road segments, then scaled using penetration ratios derived from physical counting stations run by state DOTs and the US DOT, giving about 11.2% average error against those hardware counts. Truck share is estimated by a TrafficZoom deep neural network.
Identify traffic patterns street by street and analyze the exact corridors that matter to your project.


